Site Meter The Lawyer Trader: 2011

Wednesday, December 28, 2011

Will Be Back in 2012


My wife and I are going on a 10 day cruise in the Caribbean.  Not sure how 2011 went by so quickly.  Everyone have a Happy New Year and I'll be back posting in January.

TLT

Monday, December 26, 2011

ID/NR4 Bars and Thinkscript

Linda Bradford-Raschke, Laurence Connors, Tony Crabel and many other professional traders have referenced narrow range bars as part of there trading setup arsenal.  LBR likes the ID/NR4 which stands for Inside Day Narrowest Range in 4 days.  That means the high and low of the bar have to be within the prior bar (an inside day) and the overall range itself has to be the narrowest in the last 4 bars.

Referenced in many books authored by the above mentioned traders, ID/NR4 and NR4 bars provide a low risk high reward trade setup.  The setup generally involves trading the break out above or below the ID/NR4 bar and placing a stop at the other side.  Then trail a stop for another bar or two.  LBR stresses that in the event your initial stop gets hit, you should stop and reverse so that you are now in the trade in the other direction.  She states that this is important because many of the moves can be false break outs but the move in the opposite direction can be very powerful after a false break out.  Regardless, these setups do allow for very tight stops and can provide some very good short term edges.  Adding some additional research such as current trend direction if any (Crabel does a lot of this research) or monitoring an opening range break out after a NR4 day (Crabel does this as well) or using some volume analysis can all help you filter NR4 or ID/NR4 bars for even higher probability trades.

Here's a chart, note the blue dots above bars indicate an ID/NR4 bar:

And for those of you on ThinkorSwim, here is the thinkscript:

###DELETE THIS ROW WHEN PASTING INTO TOS###


# ID/NR4 Bars
#
def range = high – low;
def na=double.nan;

def plotter=high+range*0.3;

def longvol = volatilityStdDev(100);
def shortvol = volatilityStdDev(6);

def volratio = shortvol/longvol;

def isnr4 = (range <= range[1] and range <= range[2] and range <= range[3] and range and high<high[1] and low>low[1]);

plot lowvol = if volratio<.5 and isnr4 then low-.0005 else double.nan;

lowvol.SetDefaultColor(color.violet);
lowvol.setstyle(curve.points);
lowvol.setlineWeight(3);

plot nr4 = if isnr4 then plotter else na;

nr4.SetDefaultColor(Color.yellow);
nr4.setstyle(curve.points);
nr4.setlineWeight(3);

###DELETE THIS ROW WHEN PASTING INTO TOS###

This code was adopted from a code for NR7 bars written by ReadtheProspectus at his blog with the same name.  If you like thinkscript it would be well worth it to spend some time at his blog.

Happy Holidays!

TLT

Wednesday, December 14, 2011

Covered My Eur/Usd Short

Over the past week, I have been managing one position...a short Eur/Usd.  It turned out to be a pretty decent trade that probably has more profit potential...however, booking profits seemed prudent right now.  Total, the trade booked about 400 pips which is a pretty big winner for my swing trading.  100-200 pips is the standard size for winners. 


The trade was a good one but I really wanted to blog about taking off the trade.  For me, booking profits is actually one of the hardest aspects of trading.  I have found that there are 2 methods that work for me.  A trailing stop or a profit target.  Quite often I use both.  For this trade, my take profit point was 400 pips.  It was tempting to continue to trail my stops but there is a high possibility of seeing a bounce.  3 day one direction moves usually get corrected.  Furthermore, we had a fed day yesterday and it's options expiration week..both are events that can move the equity markets and in turn put pressure on the euro.  Sometimes booking profits and sitting out for a bit is the best thing to do..as long as you fully accept that the trade "may" have been much more profitable had to left it on.

So what's the game plan?  I do think the Euro could fall quite a bit farther, it will just be a matter of patiently waiting for a pull back and an entry signal to put the trade back on.  This is likely a very crowded position and a good rally may shake out a bunch of the shorts and provide some fresh fire power for a move lower.  We'll see.


TLT

Sunday, November 27, 2011

ThinkorSwim Indicator: Multi-Time Frame Stochastics

Here's a code for a multi time frame stochastic.  This will allow you to plot a stochastic for any time frame that is greater than the one that your chart is currently on.  For example, it can be helpful to know what the hourly stochastic looks like if you're trading on a 5 min chart.  I'm playing around with using this a filter for mean reverting systems..such as ignore a "Buy Signal" if the stochastic on a higher time frame is over 60.  Here's an example of using the 15min stochastic with a 1 minute chart:

Here's the code.  To use this code, copy and paste it into TOS and then delete the // marks at the top and bottom.  These marks are necessary for posting the code on blogger and the indicator will not work in TOS if you don't delete them. 

Hope everyone had a great Thanksgiving!

TLT

//

declare lower;

input aggregationPeriod = AggregationPeriod.DAY;
input KPeriod = 10;
input DPeriod = 10;
input slowing_period = 3;

plot FullK = Average((close(period = aggregationPeriod) - Lowest(low(period = aggregationperiod), KPeriod)) / (Highest(high(period = aggregationperiod), KPeriod) - Lowest(low(period = aggregationperiod), KPeriod)) * 100, slowing_period);
plot FullD = Average(Average((close(period = aggregationPeriod) - Lowest(low(period = aggregationperiod), KPeriod)) / (Highest(high(period = aggregationperiod), KPeriod) - Lowest(low(period = aggregationperiod), KPeriod)) * 100, slowing_period), DPeriod);

//

Monday, November 7, 2011

Live Market Commentary Video

Once again, looking at the Opening Range for the Eur/Usd, the SPY and the VIX to generate trading signals. 

Have a great day.

TLT

Wednesday, November 2, 2011

Market Recap Video


Trying something new...playing around with the screen recorders..maybe gonna start recording some trading examples and market commentary.  Here's a video where I talk about today's trading in the Eur/Usd.  There's a couple of opening range breakout setups and I walk you through what types of things that I'm looking at when I put on these trades.  Volume is not the best, so turn it up to hear...I'll do better with that next time.

In the video, I mention that the Adaptive Opening Range Indicator was from Thinkscripter, however, I misspoke.  It is actually an indicator that was programmed by ReadTheProspectus and is available here.  If you're not familiar with the site, you should spend some time with it and consider donating to get access to the "Donors Only" codes.  I don't know the administrator of that site and gain nothing from this recommendation...just think it's a useful website and a good blog.

TLT

Thursday, October 27, 2011

Opening Range Breakout

I went to a networking breakfast this morning and was not in front of my screen...which means there was no trading.  Getting home, it was not surprising to see that a picture perfect opening range breakout occurred on the Eur/Usd this morning.  While I'm not going to whine and claim that I would have taken the trade and squeezed every pip out of it (may or may not have happen), I will use it as an example of what the opening range breakout set up looks like.

This is a very popular set up with day traders.  Many daytraders make most of their money trading only this set up.  It works well on stocks but it also works well with currencies and futures.What you do is mark the high and low of the first 15 minutes of trading and then put the trade on when the first 5 minute close outside of the range occurs.  That's the basic trade.  You can add other indicators  or volume to confirm or use higher time frames to filter which direction you'll take..I'll leave that up to you to play with.  Once the trade is on, place a stop below (above if it's a short trade) the range and close out the trade if it trades back into the range and closes in the range.  Then you can trail a stop using your favorite method (i.e. atr, moving average, parabolic sar, etc.) or book profits once a specific profit is reached. 

Here's the chart of today's action.  Notice that the range (the bars in the red shaded rectangle) begins at 7:00.  That's because that is the time that New York opens for forex trading.  Currencies are a little tricky because they constantly trade on different exhanges through out the day.  As a rule of thumb, I trade a currency during it's home hours (7:00 central time for US) and use the first fifteen minutes.  So I would trade the USD/JPY in the evening when Japan opens or in the morning when the US opens.  You could also trade the Eur/Usd in the early morning, for those of us in America, when London opens.


Hope everyone has a great and profitable trading day.
TLT

Tuesday, October 25, 2011

Free Fallin': NFLX

Boy oh boy, I knew that I should have shorted NFLX back when Tilson covered his short and made a big media event about it...coulda, woulda, shoulda.  Netflix has basically dropped for the past 6 months and this morning it took a big plunge.  Check out the 5 min chart:
What a drop.  As for regular trading...this volatile market chopped me up a little today and I'm laying off the gas until SPY breaks 126 on the high or 120 on the low.  As for currencies, I'm looking to go long the Eur/Usd above 1.3960.  With the Euro, the price action better be very strong, as it has been incredibly choppy with all the action in Europe.

Hope everyone's doing well.

TLT

Wednesday, September 28, 2011

Leading Indicators Study Say's Bears are Still in Control

One indicator that I created a while back and have been following is called the "Leading Indicator Study."  No, these are not the economic data leading indicators, these are just different etfs of asset classes that represent the bullishness or bearishness of the market that tend to lead big moves.  It is based on the Euro (FXE), Copper (JJC), Small Caps (IWM), Emerging Markets (EEM), VIX (VIX or VXX), Long Term Treasuries (TLT), Short Term Treasuries (SHY) and Consumer Staples (XLP). 

I'm not going to go into exactly how this works, but I wanted to share the general idea...maybe it will spark some ideas with clever traders that look at such things to derive an edge.  The basic concept is to take risk sensitive asset classes, determine whether they are in an uptrend or downtrend, and then create a score based on the trends.  This particular indicator uses a couple of regression calculations to determine the trends and then it adds points for the bullish trends and subtracts points for the bearish.  Simple enough.  Regression is not necessary, you could easily use a moving average or volatility break out system in place of the regression.  The point is to look at multiple asset classes at the same time to get a heads up on what the market's current risk appetite is.

Here's a screen shot of the indicator paired with the S&P 500, note the colors of the price bars are indicative of the bullishness (green), bearishness(red), buycaution (yellow) and sellcaution(blue):

Hopefully you found this interesting and you can work out something similar or even better to implement with your own market analysis.  As you can see with the chart, price bars are red and the indicator score is a very low -92 which confirms the bearishness of the market.  That tells me not to get too excited about any rallies until this indicator gets back to bull territory.

TLT

Wednesday, September 21, 2011

CNBC Portfolio Challenge

I couldn't help myself...I had to sign up. Not gonna spend a lot of time on it (not really a revenue producing activity) but it is fun. I put together a couple of portfolios and will manage them in my spare time just for the heck of it.

Off to a good start so far..here's the rank as of today:


1068th isn't bad considering there are over 500,000 portfolios.  We'll see how it goes.

Have a good one.

TLT

Thursday, September 15, 2011

Take a Look at the EuroDollar Index over 3 Month Libor

This is an interesting indicator. Much like the TED spread and a handful of others, it tends to give good indications of whether the market is likely to move higher or lower. Nothing is perfect, but the short term interest rate markets are usually quick to move when something is anticipated in the market. Take a look at the chart, and notice the crosses on the moving averages:
I chose to use the word "anticipate" rather than signal because that's what I use this for.  It's not a signal in and of itself, it's a tool that helps gauge the likely overall direction of the market.  So why the 3 Month Libor instead of 1 Month? No special reason, you could use 1 Month Libor..the 3 Month is a little smoother when plotted with the EuroDollar. (*Note this is the EuroDollar market that is made up of dollar deposits in other countries..this has nothing to do with the Euro Currency in the forex market).

Something interesting to watch and keep on your radar. Hope everyone is managing the volatility..it's a wild one right now.

TLT

Thursday, September 8, 2011

Index Trader Indicator for Think or Swim: Using Volume, Advance/Decline and Cumulative Tick for Day Trading

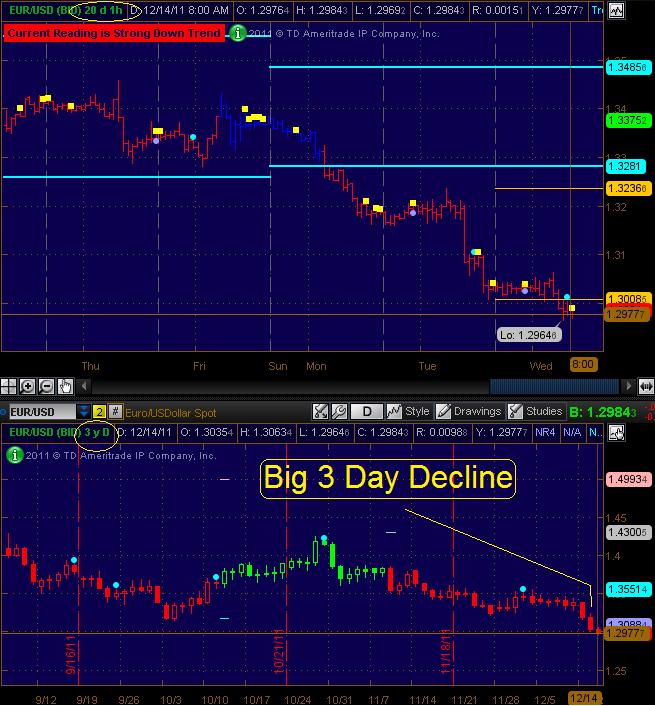
I've been playing around with a day trading indicator.  It consists of the ratio of advancing stocks to declining stocks (on the NYSE), Up volume vs. Down volume (NYSE) and the cumulative tick (also NYSE).  Basically, if advancing stocks are above declining and the UpVolume for the day is higher than the down volume, this indicator will show you that the market is bullish.  To filter these signals, I use the cumulative tick.  If the tick lines up with the other two then the bars are painted green (when bullish) or red (when bearish).  If the tick conflicts with the other indicators, the bar will be painted blue.  Check out a five minute SPY chart:

This indicator is useful for day trading, as it can help you determine where the market internals are pushing the market and get you on board with the trend as it's developing intra-day.  This indicator should not be used all by itself for entries and/or exits.  It is not perfect, as there are plenty of times when the bars are green and prices just drop.  I have been playing with it more as a filter.  For example, if I'm trading using bollinger bands, I will look for long intra-day setups when the bars are green.  Or if I'm looking to fade rallies using a stochastic oscillator, I'll look to sell an over bought signal if the bars are red.  There are lots of possibilities to incorporate this and tweak it to your liking.

Here is the think script code for think or swim if anyone out there uses TOS.

//
def VolUp = close("$UVOL");
def VolDn = close("$DVOL");

def advancers = close("$ADVN");
def decliners = close("$DECN");

def BullVol = if volup>voldn then 1 else 0;
def BullAdv = if advancers>decliners then 1 else 0;
def BearVol = if volup<voldn then 1 else 0;
def BearAdv = if advancers<decliners then 1 else 0;

def BullMode = if BullVol and BullAdv then 1 else 0;
def BearMode = if BearVol and BearAdv then 1 else 0;

def upper = no;
input hidecumtick = yes;
input symbol = "$TICK";
input period = 20;
input smooth = 5;
input lookback = 4;
input filter = 300;
def p = period;
def i = barNumber();
def na = double.nan;
#input usetrend = {"No", default "Yes"};
def usetrend = yes;
rec htick = if IsNaN(high(symbol)) then htick[1] else high("$TICK") ;
rec ltick = if IsNaN(low(symbol)) then ltick[1] else low("$TICK");
rec avgh = if i == 1 then htick else Max(filter, avgh[1] + 2 / (p + 1) * (htick - avgh[1]));
rec avgl = if i == 1 then ltick else Min(-filter, avgl[1] + 2 / (p + 1) * (ltick - avgl[1]));


def hi = high("$TICK");
def lo = low("$TICK");

def Last = if IsNaN(close(symbol)[-1]) then close(symbol) else double.nan;

def amean = if IsNaN(close) then na else (avgh + avgl) / 2;
def trendmean = if usetrend AND (htick > avgh OR ltick < avgl) then amean else 0;

def bull = if htick > avgh then htick - avgh  else 0;
def bear = if ltick < avgl then ltick - avgl  else 0;

rec ctick = if i == 1 then 0 else if IsNaN(htick) OR IsNaN(ltick) then ctick[1] else ctick[1] + bull + bear + trendmean; 

def ctickavg = ExpAverage(ctick, smooth);
def cumtick = if IsNaN(close) then na else ctickavg;
def nettick = if IsNaN(close) then na else ctick;

def zero = 0;

AssignPriceColor(if !upper then color.current else if cumtick > cumtick[lookback] AND ltick < avgl then color.green else if cumtick > cumtick[lookback] then color.gray else if cumtick < cumtick[lookback] AND htick > avgh then color.red else color.gray);

def hcumtick=if !hidecumtick then cumtick else na;
def hzero=if !hidecumtick then zero else na;
AddCloud(hcumtick, hzero );
def buy = if cumtick > cumtick[lookback] AND ltick < avgl then low - tickSize() else if cumtick > cumtick[lookback] then na else if cumtick < cumtick[lookback] AND htick > avgh then na else na;
def sell = if cumtick > cumtick[lookback] AND ltick < avgl then na else if cumtick > cumtick[lookback] then na else if cumtick < cumtick[lookback] AND htick > avgh then high + tickSize() else na;

def ahi = if IsNaN(close) then na else avgh;
def alo = if IsNaN(close) then na else avgl;
def hib = if hi < 0 then hi else na;
def lob = if lo > 0 then lo else na;
def phi = hi;
def plo = lo;

#plot zero=0;
#
# Formatting:

Def TickBull = (if cumtick > cumtick[lookback] then 1 else 0);

assignPriceColor(if BullMode and TickBull then color.Green else if BearMode then color.red else color.blue);
//


That's all folks.  I have been working on quite a few indicators and strategies lately and would be happy to share more code if there is enough interest/demand.  We'll see.  Hope everyone's trading is going well.

TLT

*****Update*****
The above code has been fixed.  A reader alerted me to a problem with the coding from the original post..not sure what happen but it appears to be a copy/paste error.  The new code should work much better

Wednesday, August 24, 2011

Jobs Resigns and $AAPL Declines

A nice little drop in $AAPL after the Jobs announcement in after-hours trading.  The important thing to watch is the follow through tomorrow morning.  If there is consistent selling but not panic selling, I would be concerned.  The pros will fade an obvious panic dump but calm consistent selling will be a sign of sophisticated people trying to unwind their positions.  Guess we'll see.

TLT

Thursday, August 11, 2011

Old Resistance Holds with $TLT

It was weird..just a few minutes ago I was scanning through some charts on FreeStockCharts and noticed that TLT, the 20+ year long bond etf, stalled out an upward advancement right at a green line that had been marked on the chart last summer.  Marking certain charts with red and green lines used to be common practice for me.  I haven't done it in a while but I do like to look at where price action is compared to old support and resistance lines..especially when price reverses right at one.  Check out the chart:

Hopefully all of you are not just holding up but also profiting from this market.  Volatility can be a great thing for certain styles of trading.  I think the worst is likely over, but you never know.

TLT

Monday, August 8, 2011

Headline Risk?

Headline Risk

What Does It Mean?
What Does Headline Risk Mean?


"The possibility that a news story will adversely affect a stock's price. Headline risk can also impact the performance of stock  market as a whole."


Read more from Investopedia.

It's hard to say, as the market never likes a "negative" event that has never occurred before.  Was there really any new information?  Does this really change anything?  There's a good chance this could be a big deal, but the other side of the coin is that the market will come to terms with it and start discounting what rating agencies have to say.

Just hang in there and don't panic.  I could be wrong but I don't see a "2008" scenario here.  As always,  only time and price will tell.


TLT

Wednesday, July 13, 2011

Review of a Trade Set Up: The Snap Crackle Pop Trade

This is a phenomenal set up in the forex and futures market.  Today, there was a great opportunity to go long the Eur/Usd with the Snap Crackle Pop trade.  The setup is basically just a "swing low" that most traders are familiar with.  A swing low is a 3 day pattern where one bar's price action is surrounded by higher highs and higher lows. Swing traders and day traders use these to go long and place a stop under the low of the swing low. The slight difference with this setup is that a couple of conditions have to be present on top of the swing low.  Let's use the recent price action in the Eur/Usd for illustrative purposes.

1.  Snap -- the instrument needs to me massively trending down and making new lows.  This is the important part of the trade that distinguishes it from a normal swing low.  The more bearish the better.  In the chart below, you can see that the Eur/Usd just broke a major support level and looked like it was going to drop like a rock.  This entices a bunch of traders to hop on to the short..even though they are late to the party.

2.  Crackle -- the crackle is when buying action kicks in and the Eur/Usd trades back up and closes near the highs with a long tail on the candlestick/bar chart.  This is commonly referred to as a bullish hammer.  These are the pros trapping the amateurs by fading the obvious "short trade" which leaves amateurs scratching their heads.

3.  Pop -- if buying continues, we wait for prices to break above the prior highs and we enter a long trade on that break.  The key to this trade is to be nimble and remember that you're probably trading a counter trend.  I like to trail a stop under the daily lows or drop down to a lower time frame (like the hourly) and trail an atr stop to get me out.  These trades usually last about 3 or 4 days (or bars on other time frames).

Here's the chart:

This trade is taking advantage of the retailers and the traders that are late to the party, over leveraged and not taking their losses.  We want to see a text book short sell that fails and traps these traders and then we ride it up as their stops are hit or when they finally throw in the towel and admit defeat.

Sound brutal?  Well no one said trading was nice.  The forex and futuers markets are zero sum markets and either you're the loser or you are taking the loser's money.  This is one of my favorite setups.  It works on all time frames but obviously, the bigger time frames like the daily chart make for bigger moves.

Hope everyone is trading well.

TLT

Saturday, July 9, 2011

Get Ready for Round 2 with Winn Dixie

Winn Dixie (WINN) is poised for take off again.  After rocketing from 6.50 to 9.50 very quickly and then pulling back, it appears that buying order flow is driving it back towards the highs.  I'm still long this one from before but I am probably going to add to it.  Below is a breakdown of the trade.
 As you can see from the above chart, the weekly chart just had a crossover on the 20 and 50 week moving averages...possibly the beginning of an uptrend.  Furthermore, the Volatility stops are still in "buy" mode.  I'll be targeting an add between 8.50 and 8.00 a share.  I'll set an initial wide stop at 7.30 and then trail the stop with the volatility stops.  We'll see what happens.  The market overall is starting to look stronger via market breadth and sentiment indicators.  This stock could really take off if buying hits the general market.  As always, time and price will tell.

TLT

Thursday, June 2, 2011

Fresh Strong Buy Signal on the EUR/USD and some Think Script Code

I'm long the Eur/Usd...my TrendFuzz system just switched from Buy to Strong Buy. The pair may make a run for it's recent highs, which would make for a great trade.  Here's the chart:

Note the bars changed from dark green to bright green indicating a "strong buy" signal.  This combined with the Trend Confirm Dots (a separate trend following system) makes the pair look bullish right now.

A quick explanation of the TrendFuzz system is in order and I'll briefly describe it since I've been referencing it for a little while now.  TrendFuzz, is a trend following system that combines a market thermometer indicator or thermo with a volatility break out system.  The thermo measures an instrument's ability to make higher highs or lower lows (similar to what A. Elder described in Come Into My Trading Room) and it combines this score with another score based on current price in relation to a couple of past prices..like prices from 20 and 50 bars ago.  So, one part of the trendfuzz indicator is based on an increased/decreased average of thermo scores and the other part is just a volatility break out confirmation...the instrument needs to move 2x its historic volatility kind of thing.

This indicator is great for catching trends and does a decent job of minimizing risk.  The volatility filter helps filter out moves that are likely to whip saw...although not all of the moves get filtered out.  The "fuzz" in trend fuzz alludes to "fuzzy logic." This is because it is an adaptive system that can change its criteria for readings based on recent trading activity.  This means that an uptrend reading from today can have different criteria than an uptrend from a month ago...hence a fuzzy definition. 

I'm not going to share the code or the internals of the full system, but, I will share the basic code for the Thermo...which is what a good part of the system revolves around.  Some of the programming might be a little redundant and amateurish because, well, I'm not a professional programmer...just a self taught market junky that knows enough to get by.  The code used in the system is similar to this one, but it has been tweeked quite a bit.  This Thermo indicator is still rather interesting and can be useful to anyone interested in a new indicator. It uses a 52 Week High/Low score verbiage but its not really referencing the 52 week high/low..that is leftover from the original indicator.  Now can be set to look back at any bar you want..like 10 bars, 20 bars or even 100 bars back, just make sure the aggregation period on the chart is the same selected for the indicator.  Here's the code for thinkorswim:
####################################################
declare lower;

input ThermoAGPeriod = {default MONTH, MIN, HOUR, DAY, WEEK};
input ThermoLookBackBars = 12;
input PlotType = {default ExpMovingAverages, Standard};

def HighLowScore = 1000*((high-high[1])/(high[1])+
(low - low[1])/low[1]);

def A = highest(high(period = ThermoAGPeriod));
def B = lowest(low(period = ThermoAGPeriod));

def FiftyTwoWeekHigh = A[ThermoLookBackBars];

def FiftyTwoWeekLow = B[ThermoLookBackBars];

def FiftyTwoWeekScore = 10 * (((high
- FiftyTwoWeekHigh)/FiftyTwoWeekHigh) +
((low - FiftyTwoWeekLow)/FiftyTwoWeekLow));

def ThermoScore = HighLowScore + FiftyTwoWeekScore;

input MAPeriodShort = 9;
input MAPeriodLong = 50;

def EMA = ExpAverage(ThermoScore, MAPeriodShort);
def EMA2 = ExpAverage (ThermoScore, MAPeriodLong);

plot Line1;
Plot Line2;

Switch (PlotType) {
case ExpMovingAverages:
    Line1 = EMA;
    Line2 = EMA2;
case Standard:
    Line1 = ThermoScore;
    Line2 = ThermoScore;
}

def InvisibleLine=close*0;
plot Line3 = InvisibleLine;
Line3.hide();


addcloud(Line1, Line2, Color.CYAN, color.Dark_RED);
addcloud(Line2, Line3, Color.Dark_Gray, Color.Magenta);     

#####################################################

Enjoy and let me know if you have any questions.

TLT

Saturday, May 14, 2011

WINNing

I couldn't help it...a Charlie Sheen reference is just to good to pass up.  But seriously, $WINN is exhibiting some interesting trading and it looks like it's ready to explode to the upside.  Check out the daily chart:

WINN is setting the stage for an accumulation break out.  After long sideways consolidations, these types of moves can be rather large.  Personally, I've taken out options positions for this trade as the options on WINN seem a little cheap...probably because of the lack of volatility lately.  The confirm dots in the chart are just a trend following indicator that I've been playing with that seems to have some promise.  It's basically just an updated version of the turtle trading break out method with a couple of small twists.  I'm finding that combining different trend following models that base their signals on different variables offers good trades.

I'm pretty sure Charlie S. would give WINN the Warlock seal of approval (okay, no more Charlie Sheen references).

Have a good weekend.

TLT

Thursday, May 5, 2011

Silver is Still Sliding: Check out $ZSL

I covered half of my silver short yesterday...maybe a little early but needed to book some profit into this crazy momentum.  The rest of the position is split between some options and a position in ZSL, the ultra inverse silver etf.  Check out this hourly chart:

I don't see may opportunities like this...so many people were long silver and emotional that it was unreal.  Even some of the guys on Fast Money (a show that I only watch to see what the masses are watching...seriously, don't watch these types of shows to take their advice) were arguing about how the fundamentals are still intact for silver, but there's going to be a lot of volatility in the short term.  That can be translated into, "I am long silver and I don't want to sell right now.  I am emotional about this position and I want the market to conform to my reality."  And there is the problem. 

So many people justify their positions with fundamental or other factors and ignore the obvious change in order flow that is taking place right before their eyes.  Who cares what the fundamentals of silver are or what the long term outlook is.  The reality of the market is that there are no longer more buyers than sellers and the big buyers, the buyers that really move markets, have been selling their positions for a couple of weeks. Arguing that the market should conform to your reality is for losers and very good value investors (many of which are wrong quite a bit and quietly blow up).

One of my friends who also happens to be one of my favorite contrarian indicators told me that he now thinks Silver will fall to $30 an ounce.  I have jokingly told him several times that he is my favorite indicator but the fact is he is priceless.  This same person told me to cover my silver short last Friday because I "was going to lose money."  He's still long silver but now he's coming to grips with the falling  prices and it appears that panic is about to set in.  That will be my indication to sell another 1/4 of my position.  The last 1/4 will be sold when my trend following system gives a sell signal.

As for the market in general, it appears that a small pullback is taking place.  I'm not changing any longs yet, as this looks like a normal pullback for now.  If that changes, and it may, then I'll change some things up.

TLT

Tuesday, May 3, 2011

Silver is Sliding

Might be jumping the gun, but I started shorting silver last week.  I rarely take on pure contrarian positions but this one was hard to pass up.  After the 6th amateur trader told me that they were never going to lose money in silver and that they were waiting for a price above $50 to sell, I began shorting.  So far it has worked, but you never know with something like this that is parabolically rising. 
I believe that the big boys have unloaded most of their holdings (see volume above) and the day traders and retailers are the main ones still playing in silver for the time being.  Day traders will be fine for the most part, but retailers can easily get hurt here.  Just my opinion and I've certainly been wrong plenty of times. 

Have a great week.

TLT

Wednesday, April 20, 2011

Looking at the S&P Bar by Bar

We've had some interesting price action over the last week.  I've taken this dip as an opportunity to add some longs for both me and some clients.  This market will likely continue higher and it will be confusing to many retailers when they see this market making new highs despite all the negative news stories.  Here's a quick break down of recent price action in the S&P via SPY:

I've pointed out 3 interesting scenarios that have taken place within the last 7 trading days.  First there was a strong swing low last Friday, which looked like an excellent bullish reversal.  That was followed by a  big gap down on Monday that had a false break to new short term lows (15-20 day lows).  The interesting thing about Monday is that a bunch of stops were likely taken out and then the market closed pretty close to the highs for the day.  I'd imagine quite a few retailers lost some money on that move.  Tuesday, the bulls were definitely back in control and going long above Monday's highs was a great short term long setup.  Then today...we gapped way up to 6 day highs and didn't lose too much ground.

From my point of view, this type of price action is showing that bulls are still in control.  Every time the market looks like its setting up a shorting opportunity, the move gets faded as buyers hit the market.  The long and intermediate trends are both up and that's how I will trade until that changes.  Going short in this market is for suckers that like to pick tops (a skill that very few can successfully do) or major suckers that like to pick up nickels in front of a steam roller (sure you might make a few cents here and there but you're taking an enormous risk).  As always, this is just one person's opinion and I am wrong just like many others...I've just learned to cut my losses over the years and to hold on to winners when the current trade is acting "right." 

Outside of the market, it has been hectic lately.  Work is incredibly busy and my wife and I recently closed on a new home and moved about two weeks ago.  Unpacking always takes about 10 times longer than I think it will..eh, you guys know about that.  I guess I'm saying these things to explain why posting has been limited lately.  I have managed to read a couple of interesting books lately and I plan on posting a couple of reviews on them.  Maybe I'll have time this weekend. 

Hopefully everyone is off to a profitable start this week!  Keep your head up and stay alert..this is a crazy market.


TLT

Thursday, March 31, 2011

Popular Post Replay: The Taco Liberty Bell?

This post was first published on April Fool's Day in 2009 and it was one of the more popular posts of that year.  Enjoy.

A little April fools day humor courtesy of the Huffington Post.

The Taco Liberty Bell

In 1996, Taco Bell ran an ad in six major newspapers saying:
"In an effort to help the national debt, Taco Bell is pleased to announce that we have agreed to purchase the Liberty Bell, one of our country's most historic treasures. It will now be called the 'Taco Liberty Bell' and will still be accessible to the American public for viewing. While some may find this controversial, we hope our move will prompt other corporations to take similar action to do their part to reduce the country's debt."

Many politicians' offices were taken in, as the Park Service received phone calls from aides to Sens. Bill Bradley (D-NJ) and J. James Exon (D-Neb).

Sunday, March 13, 2011

Iraqi Dinar

First of all, I'm going to admit that this post might upset some folks...but if you're one of them, then it might be a worthwhile exercise to ask yourself why you're upset.  The Iraqi Dinar...what?  I think we've all heard about it by now.  Just in case you've been in a cave for a while, the story is that some document was signed back in 2005-2006 or somewhere around there, that made it legal for Americans to buy and circulate Iraqi Dinar in an attempt to help Iraq.  These are very dumbed down and possibly even wrong facts, but the story is something like that.

Then it goes on to say that the Iraqi Dinar was trading at 1 Iraqi Dinar to .30 US Dollars prior to this last war.  Now it's trading somewhere in the 1 Dinar = .0008 range and is worth less than the paper its printed on.  That means you can buy a cool Million of Dinar for $800 plus the dealers mark up..say an extra $150.  For $850 we can invest in the Dinar.  The pitch gets even deeper now because we all know that Iraq has oil...and oil will get the country going again..right?  So lets say that oil trades back up to $150 a barrel (which it's working on right now) and this helps pull Iraq out of the crapper.  Now we're talking.  In fact, lets even be conservative and say that the Dinar might trade up to a third of its pre-war value...we like to be conservative. 

Quick re-cap:  we bought a million Dinars for $950 and we're forecasting it to trade to .10 (roughly 1/3 of its pre-war value).  That means our 1,000,000 Dinar X .10 Dollars will become $100,000.  Wow, that's a big profit.  Turning $950 into $100,000...it almost sounds to good to be...

I'm not going to say that the Dinar play is not going to pan out, but I will comment on what I've noticed.  I work in the financial industry and I talk to all kinds of people.  Some sophisticated investors/traders, some business owners and some retailers.  I thought that the Dinar play was interesting back when I first heard about it in 2007...now I'm not so sure.  Maybe it will eventually pan out..like in another 5-10 years...but I doubt that the return will be in the 10,000% range.  In the past 6 months, I've had no less that 15 people ask me about the "Dinar" play.  They usually begin with, "I heard that you trade currency."  To which I reply, "Yes, it is one of my favorite asset classes."  Thinking to myself, "Alright, I've found a retail currency trader," which I love to speak with because you can learn so much from them.  Currency "Forex" traders are all useful, as they either are examples of great traders, or they are examples of what not to do...generally the latter. 

Regardless, after the guy or gal mentions or asks about me trading currency and I mentally gear up to hear about the euro, yen, aussie, kiwi, krona, frank, yuan, or thai bhat...they inevitably say in their most sophisticated low voice, "What do you think of the Dinar?"  Uggghh.  One guy told me that he's expecting to come into lots of money soon, even though he doesn't have much now, and he wants to have a plan in place.  Then he went on to tell me that he was going to cash in with the Dinar. 

I think I've pretty much made my point.  If it's too good to be true, be very, very very careful.  If all your friends at your local Cigar Lounge that you hang out at constantly think that they are all gonna get rich with the Dinar, be very, very very careful.  If your counting your chickens before your Dinars hatch and you want to have things in place, be very, very, very careful.  Once again, this article is not saying that the Dinar is a scam (although there have been some be reports of counterfeit dinar being sold) and it's not saying that the Dinar will not appreciate SOMEDAY...make note of this because Dinar people get pretty emotional when talking about their golden goose.  I'm just stressing that history has shown that when lots and lots of people expect to make lots and lots of money off of something, it's generally the initial sellers and some very lucky people in the beginning that make any money at all.  Google any of the following for great examples: Tulips, Ostriches, Emus, South Sea Company, CMGI, or  Sub-Prime Mortgages.  If you already hold Dinar, should you sell it?  Not necessarily, just be realistic with your time frame and your expectations. 

Who knows, I've certainly been wrong plenty of times before and this might not be an exception, however, there are some troubling signs in what I'm seeing with this "Dinar" play. 

Hope everyone has had a great weekend!

TLT

Thursday, March 10, 2011

$SBUX, Trend Following and New Nifty Add Arrows

One of the few winners today was Starbucks.  The market gave a very favorable reaction to the news of Starbucks and Green Mountain Coffee working together for a Starbucks single serve coffee.  Notice that this stock is in a Strong Up Trend, as indicated by the rising price and the "Strong Up Trend" label in the top left hand corner of the chart below.  This chart shows the latest version of my trend following indicator, the TLT Trender.  I've been referring to this one as Trend Fuzz, as it uses a little fuzzy logic to help determine trends and add levels.  Here's the chart:

Note the Nifty Add Arrows.  This is a very new addition to the system that I finished coding today.  They seem to have promise, although I haven't fully tested them yet.  For those of you that read Moaxian's blog, recently you've heard him mention the importance of adding to winners.  There's a lot of truth to this, as the point of trend following is to suck out as much profit from good trends.  I'll post more about this once I spend some more time on it. 

For now, we need to add SBUX to our watchlists, as it is showing amazing relative strength. 


TLT

Tuesday, March 8, 2011

Big Break Out in $UNH

United Health is a position that I put on back in December and it has been nice watching it break though resistance and trend higher.  Check out the chart:

As noted in the chart, it might be a good idea to buy when the price pulls back to the 20 period moving average (yes the chart says 20 day but its really a 20 week moving average).  This allows for an entry in a range where risk can be adequately controlled.  Just a trade idea..I'll probably add to my position if it pulls back to that range.

Hope everyone's having a great week so far.

TLT

Monday, February 28, 2011

$HERO: Follow Up on a Winner

Back in December I posted about HERO and said that it was blasting off.  Here's a quick update on this play.  It has continued on its uptrend tear since the announcement of it taking over $HAWK, which now makes HERO the only shallow water driller in the Gulf of Mexico.  Although its in a major uptrend, HERO is a little overbought on both the Weekly and Daily time frames.  That means that it's most likely prudent to wait for a good pullback before entering a long position.  Here's an updated chart:

I'll continue to keep an eye on this one because I don't think it has fully played out.  Hope everyone is doing well.

TLT

Sunday, February 20, 2011

A Look at Tomorrow's Trading: $AAPL and its Implied Range

Would it be nice to know the range for Apple's trading tomorrow?  It could be useful.  Here's a cool indicator that I coded and have been playing with quite a bit lately.  It's a band of the trading range for tomorrow that is derived from the implied volatility of Apple's options and I call it tomorrow's "implied range".  Here's a screen shot:
A crystal ball?  Not quite.  But it is a cool way to see which direction that tge market has a bias for.  I run these numbers for the entire S&P500 on a daily basis to see what tomorrow's implied range and what next month's implied range is for every stock.  I track these number in a spread sheet.  I'm still figuring out how to incorporate this into other aspects of my trading..it seems to have some good potential.

So, for what it's worth, the options market is predicting that $AAPL will trade down tomorrow.  Since Apple is a Leader in the market, this might drag down the entire market.  It might be nice to know how many stocks in the S&P500 the options market is predicting will trade higher or lower...that could provide a nice edge going into the trading day.

I hope everyone's ready for another great trading week.

TLT

**************
As someone was nice enough to point out...today is president's day so the markets are closed.  This range would be the implied range for the next trading day which is Tuesday.

Tuesday, February 8, 2011

Using a Correlation Indicator in Trading--Plus the TOS Script

I've recently been utilizing a correlation indicator with my intraday trading.  In particular, I like to use a correlation indicator with Think or Swim when trading the Eur/Usd...I like to follow the correlation of the Eur/Usd to the E-Mini futures contract (/es).  This can be beneficial when you like to use market internals while trading.  For instance, I'm always watching NYSE Advance/Declines, NYSE UpVolume vs. DownVolume, the TICK and the VIX.  These indicators are great for trading stocks but are sometimes useless when trading a currency pair or commodity.

The answer?  Watch a correlation chart of the pairs.  When the correlation is strong and rising, the market internals are more useful for trading the Eur/Usd and when the correlation is weak and falling, I know to ignore them.  Here's a chart:
So as you can see, the Blue Line is the actual correlation and the Blue and Purple histogram is the spread between the 20 period EMA of the Correlation and the Correlation.  The histogram helps with the determination of whether the correlation is growing stronger and weaker and the actual correlation line is helpful to know how correlated the securities are.  This type of strategy is helpful with currencies, but it can also be applied to all types of trading:  stocks, sectors, commodities, and futures of all sorts.  For instance, you can watch the correlation between the gold contract and Gold Corp (GG) when day trading GG.  Or the correlation between gold and equities in general could be helpful too.  Just food for thought. 

In case any of you out there like to dabble with Think or Swim scripts here's the code for this indicator.  It is just a modified version of the correlation indicator that comes stock with think or swim.  Here you go:

 ######################################
declare lower;

input length = 50;
input correlationWithSecurity = "/ES";
input MAPeriod = 20;

def Correlation = correlation(close, close(correlationWithSecurity), length);

def correlationavg = ExpAverage(correlation, MAPeriod);

plot data = Correlation - correlationavg;

plot data2 = correlation;

data2.setdefaultColor(color.blue);

def data3 = 0;


data.SetPaintingStrategy(paintingstrategy.histogram);

data.assignvaluecolor(if data>0 then getcolor(1) else getcolor(0));

addcloud(data2, data3, getcolor(1), getcolor(0));
###################################################

Hope all is well with everyone!

TLT

Sunday, February 6, 2011

A Glimpse at the TLT Trender v3

Haven't posted in a while, I've just been really busy with work and life in general.  All though I haven't posted much, I have still been very active in the markets.  Also, I've been working on the next generation of my trend following system--The TLT Trender, which is now on its third version.  This version is taking a little while, mainly because I've been coding it myself and I've been coding it for Think or Swim, as opposed to MetaTrader 4 on the last version.  Here's a screen shot of what it looks like right now: 
As you can see from the chart above, the bars on the chart change color based on the current signal.  The bars are changing color based on the reading of the Thermo Adaptive indicator down in the second indicator window.  The Thermo Adaptive indicator is the heart of the system and the ATR Average Compare indicator in the third window acts as a confirmation of trend (2 is a strong uptrend, 1 is weak uptrend, 0 is neutral, -1 is weak down trend and -2 is a strong downtrend). 

The Thermo indicator is based on the previous thermometer that I've posted on before.  Although it is similar, this version is much different and far more sophisticated.  This indicator constantly tracks a stock's ability to make higher highs and higher lows and trade around significant levels (like 52 week highs or 20 day highs) and then the indicator tracks current prices verses different averages of these thermo readings.  The different averages are actually adaptive averages (hence Thermo Adaptive) and they will tighten up when trending and loosen up when price action is choppy and inefficient.

I'll post more about these new versions of my indicators soon and maybe post some of the code for other Think or Swimmers out there.  One neat way that I've recently (like a week ago) began implementing this indicator is by taking current readings of every stock in the S&P 500 on three different time frames on a daily basis.  This is allowing me to track the trends in different sectors on different time frames to get a feel for the orderflow in the market.  It's still early and there's much more work to be done.  I'll post more soon.

TLT


Thursday, January 13, 2011

Kaboom!..Look at MRO

I've been liking MRO for a month now, and this morning it exploded.  Great fundamentals with an excellent technical pattern.  I haven't had a chance to read the details on the split up that was announced this morning, but I'd be willing to bet that there's still some value left in this one.  Check out today's volume:

Keep an eye on this one.

TLT

Monday, January 10, 2011

C.O.T. Spells Continued Trouble for the Euro

The Commitment of Traders Report is not the tell all "perfect indicator" but it is something to keep an eye on and use as part of the mix in your analysis.  It gives you an inside look into what the big boys are doing and right now it spells trouble for the Eur/Usd.  Here's the daily chart with the C.O.T.:

If you're interested in using the C.O.T. here is an excellent website that you should check out.  So, as much as I want to fade the move in the Euro because I believe that it will trade higher, the trend, the recent break of resistance and the C.O.T. readings all say that buying the Euro right now is a very bad idea.  That means I will fade my subjective feelings and follow the charts and the objective factors listed above. 

TLT

Saturday, January 8, 2011

Is $ATPG on Your Radar?

If it's not already on your watch list, you should add this one.  $ATPG has been a powerful play and it's picking up momentum.  I believe there's still room for this stock to run as it is slowly trending higher, as opposed to a parabolic rise (i.e. HERO, MPET, GEOI).  I know some value guys that were scooping this up in the sub $10 levels and most of them are still holding and buying on dips.  I've been waiting for the signal to get in and will likely hop on this trend with the next significant pull back.  Here's the chart:

As you can see, the weekly chart has been consistently heading higher and with the political mess surrounding drillers like ATP, there's likely going to be explosive up moves with any news that is percieved to be favorable.

It is important to have a good watch list of some potential energy and commodity stocks that you can follow on a daily and weekly basis.  Mine consists of:  HAWK, ATPG, GEOI, MXE, HERO, , CWEI, MRO, XOM, SLB, EP, ABX, NEM, FCX...and a few others.  Over the past couple of weeks, we have seen the dollar strengthen quite a bit which is significant.  Why?  Because stocks are slightly overbought in general, commodities have risen quickly, especially coal, aluminum, gold and silver and longer term treasuries have fallen substantially.  This sets the stage for a pullback in general but with the Eur/Usd falling below 1.2950, market participants will likely cut their exposure to risk and commodities, bonds and stocks will react to this.

I don't believe that it will be a huge reversal and will likely be a healthy pullback that will be percieved as a good buying opportunity.  That's just my opinion and if some substantial global macro shift occures (like the EU splitting up) then all of this is null and void and I'll have to adjust my analysis.  But without a substantial event like a sovereign default, a wave a municipal defaults, or some horrendous economic data any dip will likely just be a dip.  That's why having the watchlist of good pre-planned trade candidates is so important.  When everyone else is panicking, you can go in a sweep up ATPG at a good price that allows for a lower risk entry. 

Time and price action will tell.  Hope everyone's having a great start to the new year!

TLT

Sunday, January 2, 2011

Excellent Excerpt

Here is an excellent excerpt from a book that I'm currently reading.  It's amazing to think that in 1991, Ed Thorp called it, saying that Madoff had to be a fraud.

He [Ed Thorp] also worked as a consultant for pension funds and endowments.  In 1991, a company asked Thorp to look over its investment portfolio.  As he combed through the various holdings, he noticed one particular investment vehicle that had produced stunning returns throughout the 1980s.  Every single year, it put up returns of 20 percent or more, far outpacing anything Thorp had ever seen--even Princeton/Newport [Thorp's hedgefund].  Intrigued, and a bit dubious, he delved further into the fund's strategies, requesting documents that listed its trading activities.  The fund, based in New York's famed Lipstick Building on Third Avenue, supposedly traded stock options on a rapid-fire basis, benefiting from a secret formula that allowed it to buy low and sell high...

It took Thorp about a day to realize the fund was a fraud. ... He told the firm that made the investment to pull its money out of the fund, which was called Bernard L. Madoff Investment Securities.


The above excerpt is from The Quants: How a New Breed of Math Whizzes Conquered Wall Street and Nearly Destroyed It  by Scott Patterson.