Site Meter The Lawyer Trader: Eur/Usd
Showing posts with label Eur/Usd. Show all posts

Friday, September 7, 2012

Do More of What Works...

I've been reading Jack Schwager's Hedge Fund Market Wizards, which is a phenomenal book and is just as good as his first two and I highly recommend it to anyone who trades or is interested in trading.  One of the hedge fund managers in the book gives the advice of "find out what works and do more of that" or something to that effect.  Although simplistic, there is a lot to this.  One thing that I've been doing more of lately is active currency trading.  Why?  Simply because my account records show that it works for me.

That is why I want to talk about how smooth the currency market and in particular the Eur/Usd currency pair has been lately for short-term trend and swing trading.  When trading currencies, you must have a routine and specific set ups that you look for and then trade them.  And when those set ups are working well you have to trade them more.  Right now, the opening range breakout trade has been excellent.  The past two days have provided great opportunities to make significant returns with only trading this set up.

I have addressed the opening range break out trade in several posts, but I'll quickly explain what it is for those that are unfamiliar with it.  Basically, you take the first 15 minutes of trading (or it can be 5 minutes or 30..different people use different times) and you note the high and low of the period.  That creates the range. Then you patiently wait for the price action to trade out of the range and trade in that direction.  Generally, I'll day trade with the 5 minute and 1 minute charts.  I'll first look to the hourly and daily charts to determine the bias or the primary trend and then look to for break outs in that direction to trade.  So for the past few days, the bias has been to the higher side...that tells me the path of least resistance is higher and I should look for long trades.

Then I wait for the break out and put the trade on immediately after a 5 minute bar closes outside of the range.  After that I trail a stop with the 1 minute chart and look to book partial profits into momentum and use the trailing stop on the remainder of the position.  If the currency trades back into the range or to the bottom of the range you get out..or have a stop sitting there.  With currencies, it is a little difficult to determine the open.  I will generally trade the 8:30 stock market open with the Eur/Usd since it is pretty correlated with the US stock market.  After I've exited a profitable trade, I look for pullbacks and the support to initiate a follow up trade back to the highs.  After this, I'll look for the highs to be taken out and then trade that break out.  Then I'll look for another pullback from the new high and once it finds support I'll put on another trade.  That's it..plain and simple.  If I'm seeing follow through and the trade is working, I'll keep doing it over and over and over.

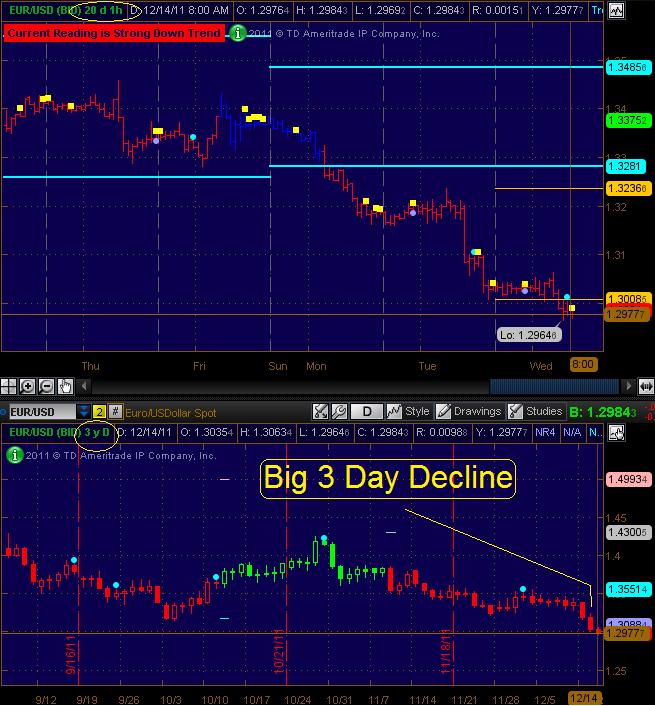
Here's a 5 minute chart with today's Eur/Usd with an opening range plot on the chart and some of the trades that I made today.
The opening range is the yellow shaded region.  The bars are all green on this chart because my trendfuzz indicator was in Strong Up Trend mode all day long...not a common event.  Notice that I did not take the OR break below the opening range, as this was a low probability trade given that the trendfuzz was green and the overall bias was up...that's not to say that it always turns out this way, just that today was a perfect day not to take the short trade.  Other days I might take the short trade even with a prevailing bias to the upside, I would just trade a smaller position and book profits very quickly.  Today was a little different because yesterday was incredibly strong and my personal sentiment is very bullish.

This type of trading can be very profitable and very rewarding, you just have to maintain discipline to wait for the proper entries and cut losses quickly.  It is by no means easy and often is very frustrating which is why some people are not suited for day trading.  Over the years, I've gone through periods where I thought I was good at it and was very suited for it and other times where I questioned whether it was for me.  The thing that I've noticed is that day trading equities is a little more hit or miss with me but currencies have been profitable for several years..I just have to stick with it and trade through those incredibly difficult draw downs that have a tendency to leave traders gun shy right at the moment that the next winning trade needs to be put on.  Ok, that's enough rambling for one day.  Hope everyone had a great week and has a great weekend.

TLT

Wednesday, January 18, 2012

LIve Trade: Opening Range BreakOut in the Eur/Usd

I've got a position on in the Eur/Usd today.  So far, it is working out to be a potentially good opening range break out trade.  I've put on 2 units of the trade and am trailing one unit with an ATR stop.  Here's a screen shot of three charts:

Notice that I'm looking at the S&P (via SPY) and the VIX in addition to the Eur/Usd.  It is important to see that SPY is above it's opening range and the internals are bullish (as indicated by the green painted bars on the spy chart).  The VIX is pulling in too..so along with spy and internals, it shows that the markets are all working together which gives the trade a higher probability of being successful.  At this point there's not much to do but wait for pull backs to add to the position and/or get out once price action starts tripping sell signals.

Hope everyone's having a great day.

TLT

Wednesday, January 11, 2012

Got a Sell Signal on the Euro this Morning

Building a short in the Euro/Usd, beginning with a fresh sell signal that occurred this morning. 

I hope everyone's off to a great start for the new year..let's make it a good one.

TLT

Wednesday, December 14, 2011

Covered My Eur/Usd Short

Over the past week, I have been managing one position...a short Eur/Usd.  It turned out to be a pretty decent trade that probably has more profit potential...however, booking profits seemed prudent right now.  Total, the trade booked about 400 pips which is a pretty big winner for my swing trading.  100-200 pips is the standard size for winners. 


The trade was a good one but I really wanted to blog about taking off the trade.  For me, booking profits is actually one of the hardest aspects of trading.  I have found that there are 2 methods that work for me.  A trailing stop or a profit target.  Quite often I use both.  For this trade, my take profit point was 400 pips.  It was tempting to continue to trail my stops but there is a high possibility of seeing a bounce.  3 day one direction moves usually get corrected.  Furthermore, we had a fed day yesterday and it's options expiration week..both are events that can move the equity markets and in turn put pressure on the euro.  Sometimes booking profits and sitting out for a bit is the best thing to do..as long as you fully accept that the trade "may" have been much more profitable had to left it on.

So what's the game plan?  I do think the Euro could fall quite a bit farther, it will just be a matter of patiently waiting for a pull back and an entry signal to put the trade back on.  This is likely a very crowded position and a good rally may shake out a bunch of the shorts and provide some fresh fire power for a move lower.  We'll see.


TLT

Sunday, November 27, 2011

ThinkorSwim Indicator: Multi-Time Frame Stochastics

Here's a code for a multi time frame stochastic.  This will allow you to plot a stochastic for any time frame that is greater than the one that your chart is currently on.  For example, it can be helpful to know what the hourly stochastic looks like if you're trading on a 5 min chart.  I'm playing around with using this a filter for mean reverting systems..such as ignore a "Buy Signal" if the stochastic on a higher time frame is over 60.  Here's an example of using the 15min stochastic with a 1 minute chart:

Here's the code.  To use this code, copy and paste it into TOS and then delete the // marks at the top and bottom.  These marks are necessary for posting the code on blogger and the indicator will not work in TOS if you don't delete them. 

Hope everyone had a great Thanksgiving!

TLT

//

declare lower;

input aggregationPeriod = AggregationPeriod.DAY;
input KPeriod = 10;
input DPeriod = 10;
input slowing_period = 3;

plot FullK = Average((close(period = aggregationPeriod) - Lowest(low(period = aggregationperiod), KPeriod)) / (Highest(high(period = aggregationperiod), KPeriod) - Lowest(low(period = aggregationperiod), KPeriod)) * 100, slowing_period);
plot FullD = Average(Average((close(period = aggregationPeriod) - Lowest(low(period = aggregationperiod), KPeriod)) / (Highest(high(period = aggregationperiod), KPeriod) - Lowest(low(period = aggregationperiod), KPeriod)) * 100, slowing_period), DPeriod);

//

Monday, November 7, 2011

Live Market Commentary Video

Once again, looking at the Opening Range for the Eur/Usd, the SPY and the VIX to generate trading signals. 

Have a great day.

TLT

Wednesday, November 2, 2011

Market Recap Video


Trying something new...playing around with the screen recorders..maybe gonna start recording some trading examples and market commentary.  Here's a video where I talk about today's trading in the Eur/Usd.  There's a couple of opening range breakout setups and I walk you through what types of things that I'm looking at when I put on these trades.  Volume is not the best, so turn it up to hear...I'll do better with that next time.

In the video, I mention that the Adaptive Opening Range Indicator was from Thinkscripter, however, I misspoke.  It is actually an indicator that was programmed by ReadTheProspectus and is available here.  If you're not familiar with the site, you should spend some time with it and consider donating to get access to the "Donors Only" codes.  I don't know the administrator of that site and gain nothing from this recommendation...just think it's a useful website and a good blog.

TLT

Thursday, October 27, 2011

Opening Range Breakout

I went to a networking breakfast this morning and was not in front of my screen...which means there was no trading.  Getting home, it was not surprising to see that a picture perfect opening range breakout occurred on the Eur/Usd this morning.  While I'm not going to whine and claim that I would have taken the trade and squeezed every pip out of it (may or may not have happen), I will use it as an example of what the opening range breakout set up looks like.

This is a very popular set up with day traders.  Many daytraders make most of their money trading only this set up.  It works well on stocks but it also works well with currencies and futures.What you do is mark the high and low of the first 15 minutes of trading and then put the trade on when the first 5 minute close outside of the range occurs.  That's the basic trade.  You can add other indicators  or volume to confirm or use higher time frames to filter which direction you'll take..I'll leave that up to you to play with.  Once the trade is on, place a stop below (above if it's a short trade) the range and close out the trade if it trades back into the range and closes in the range.  Then you can trail a stop using your favorite method (i.e. atr, moving average, parabolic sar, etc.) or book profits once a specific profit is reached. 

Here's the chart of today's action.  Notice that the range (the bars in the red shaded rectangle) begins at 7:00.  That's because that is the time that New York opens for forex trading.  Currencies are a little tricky because they constantly trade on different exhanges through out the day.  As a rule of thumb, I trade a currency during it's home hours (7:00 central time for US) and use the first fifteen minutes.  So I would trade the USD/JPY in the evening when Japan opens or in the morning when the US opens.  You could also trade the Eur/Usd in the early morning, for those of us in America, when London opens.


Hope everyone has a great and profitable trading day.
TLT

Wednesday, July 13, 2011

Review of a Trade Set Up: The Snap Crackle Pop Trade

This is a phenomenal set up in the forex and futures market.  Today, there was a great opportunity to go long the Eur/Usd with the Snap Crackle Pop trade.  The setup is basically just a "swing low" that most traders are familiar with.  A swing low is a 3 day pattern where one bar's price action is surrounded by higher highs and higher lows. Swing traders and day traders use these to go long and place a stop under the low of the swing low. The slight difference with this setup is that a couple of conditions have to be present on top of the swing low.  Let's use the recent price action in the Eur/Usd for illustrative purposes.

1.  Snap -- the instrument needs to me massively trending down and making new lows.  This is the important part of the trade that distinguishes it from a normal swing low.  The more bearish the better.  In the chart below, you can see that the Eur/Usd just broke a major support level and looked like it was going to drop like a rock.  This entices a bunch of traders to hop on to the short..even though they are late to the party.

2.  Crackle -- the crackle is when buying action kicks in and the Eur/Usd trades back up and closes near the highs with a long tail on the candlestick/bar chart.  This is commonly referred to as a bullish hammer.  These are the pros trapping the amateurs by fading the obvious "short trade" which leaves amateurs scratching their heads.

3.  Pop -- if buying continues, we wait for prices to break above the prior highs and we enter a long trade on that break.  The key to this trade is to be nimble and remember that you're probably trading a counter trend.  I like to trail a stop under the daily lows or drop down to a lower time frame (like the hourly) and trail an atr stop to get me out.  These trades usually last about 3 or 4 days (or bars on other time frames).

Here's the chart:

This trade is taking advantage of the retailers and the traders that are late to the party, over leveraged and not taking their losses.  We want to see a text book short sell that fails and traps these traders and then we ride it up as their stops are hit or when they finally throw in the towel and admit defeat.

Sound brutal?  Well no one said trading was nice.  The forex and futuers markets are zero sum markets and either you're the loser or you are taking the loser's money.  This is one of my favorite setups.  It works on all time frames but obviously, the bigger time frames like the daily chart make for bigger moves.

Hope everyone is trading well.

TLT

Thursday, June 2, 2011

Fresh Strong Buy Signal on the EUR/USD and some Think Script Code

I'm long the Eur/Usd...my TrendFuzz system just switched from Buy to Strong Buy. The pair may make a run for it's recent highs, which would make for a great trade.  Here's the chart:

Note the bars changed from dark green to bright green indicating a "strong buy" signal.  This combined with the Trend Confirm Dots (a separate trend following system) makes the pair look bullish right now.

A quick explanation of the TrendFuzz system is in order and I'll briefly describe it since I've been referencing it for a little while now.  TrendFuzz, is a trend following system that combines a market thermometer indicator or thermo with a volatility break out system.  The thermo measures an instrument's ability to make higher highs or lower lows (similar to what A. Elder described in Come Into My Trading Room) and it combines this score with another score based on current price in relation to a couple of past prices..like prices from 20 and 50 bars ago.  So, one part of the trendfuzz indicator is based on an increased/decreased average of thermo scores and the other part is just a volatility break out confirmation...the instrument needs to move 2x its historic volatility kind of thing.

This indicator is great for catching trends and does a decent job of minimizing risk.  The volatility filter helps filter out moves that are likely to whip saw...although not all of the moves get filtered out.  The "fuzz" in trend fuzz alludes to "fuzzy logic." This is because it is an adaptive system that can change its criteria for readings based on recent trading activity.  This means that an uptrend reading from today can have different criteria than an uptrend from a month ago...hence a fuzzy definition. 

I'm not going to share the code or the internals of the full system, but, I will share the basic code for the Thermo...which is what a good part of the system revolves around.  Some of the programming might be a little redundant and amateurish because, well, I'm not a professional programmer...just a self taught market junky that knows enough to get by.  The code used in the system is similar to this one, but it has been tweeked quite a bit.  This Thermo indicator is still rather interesting and can be useful to anyone interested in a new indicator. It uses a 52 Week High/Low score verbiage but its not really referencing the 52 week high/low..that is leftover from the original indicator.  Now can be set to look back at any bar you want..like 10 bars, 20 bars or even 100 bars back, just make sure the aggregation period on the chart is the same selected for the indicator.  Here's the code for thinkorswim:
####################################################
declare lower;

input ThermoAGPeriod = {default MONTH, MIN, HOUR, DAY, WEEK};
input ThermoLookBackBars = 12;
input PlotType = {default ExpMovingAverages, Standard};

def HighLowScore = 1000*((high-high[1])/(high[1])+
(low - low[1])/low[1]);

def A = highest(high(period = ThermoAGPeriod));
def B = lowest(low(period = ThermoAGPeriod));

def FiftyTwoWeekHigh = A[ThermoLookBackBars];

def FiftyTwoWeekLow = B[ThermoLookBackBars];

def FiftyTwoWeekScore = 10 * (((high
- FiftyTwoWeekHigh)/FiftyTwoWeekHigh) +
((low - FiftyTwoWeekLow)/FiftyTwoWeekLow));

def ThermoScore = HighLowScore + FiftyTwoWeekScore;

input MAPeriodShort = 9;
input MAPeriodLong = 50;

def EMA = ExpAverage(ThermoScore, MAPeriodShort);
def EMA2 = ExpAverage (ThermoScore, MAPeriodLong);

plot Line1;
Plot Line2;

Switch (PlotType) {
case ExpMovingAverages:
    Line1 = EMA;
    Line2 = EMA2;
case Standard:
    Line1 = ThermoScore;
    Line2 = ThermoScore;
}

def InvisibleLine=close*0;
plot Line3 = InvisibleLine;
Line3.hide();


addcloud(Line1, Line2, Color.CYAN, color.Dark_RED);
addcloud(Line2, Line3, Color.Dark_Gray, Color.Magenta);     

#####################################################

Enjoy and let me know if you have any questions.

TLT

Tuesday, February 8, 2011

Using a Correlation Indicator in Trading--Plus the TOS Script

I've recently been utilizing a correlation indicator with my intraday trading.  In particular, I like to use a correlation indicator with Think or Swim when trading the Eur/Usd...I like to follow the correlation of the Eur/Usd to the E-Mini futures contract (/es).  This can be beneficial when you like to use market internals while trading.  For instance, I'm always watching NYSE Advance/Declines, NYSE UpVolume vs. DownVolume, the TICK and the VIX.  These indicators are great for trading stocks but are sometimes useless when trading a currency pair or commodity.

The answer?  Watch a correlation chart of the pairs.  When the correlation is strong and rising, the market internals are more useful for trading the Eur/Usd and when the correlation is weak and falling, I know to ignore them.  Here's a chart:
So as you can see, the Blue Line is the actual correlation and the Blue and Purple histogram is the spread between the 20 period EMA of the Correlation and the Correlation.  The histogram helps with the determination of whether the correlation is growing stronger and weaker and the actual correlation line is helpful to know how correlated the securities are.  This type of strategy is helpful with currencies, but it can also be applied to all types of trading:  stocks, sectors, commodities, and futures of all sorts.  For instance, you can watch the correlation between the gold contract and Gold Corp (GG) when day trading GG.  Or the correlation between gold and equities in general could be helpful too.  Just food for thought. 

In case any of you out there like to dabble with Think or Swim scripts here's the code for this indicator.  It is just a modified version of the correlation indicator that comes stock with think or swim.  Here you go:

 ######################################
declare lower;

input length = 50;
input correlationWithSecurity = "/ES";
input MAPeriod = 20;

def Correlation = correlation(close, close(correlationWithSecurity), length);

def correlationavg = ExpAverage(correlation, MAPeriod);

plot data = Correlation - correlationavg;

plot data2 = correlation;

data2.setdefaultColor(color.blue);

def data3 = 0;


data.SetPaintingStrategy(paintingstrategy.histogram);

data.assignvaluecolor(if data>0 then getcolor(1) else getcolor(0));

addcloud(data2, data3, getcolor(1), getcolor(0));
###################################################

Hope all is well with everyone!

TLT

Monday, January 10, 2011

C.O.T. Spells Continued Trouble for the Euro

The Commitment of Traders Report is not the tell all "perfect indicator" but it is something to keep an eye on and use as part of the mix in your analysis.  It gives you an inside look into what the big boys are doing and right now it spells trouble for the Eur/Usd.  Here's the daily chart with the C.O.T.:

If you're interested in using the C.O.T. here is an excellent website that you should check out.  So, as much as I want to fade the move in the Euro because I believe that it will trade higher, the trend, the recent break of resistance and the C.O.T. readings all say that buying the Euro right now is a very bad idea.  That means I will fade my subjective feelings and follow the charts and the objective factors listed above. 

TLT

Saturday, January 8, 2011

Is $ATPG on Your Radar?

If it's not already on your watch list, you should add this one.  $ATPG has been a powerful play and it's picking up momentum.  I believe there's still room for this stock to run as it is slowly trending higher, as opposed to a parabolic rise (i.e. HERO, MPET, GEOI).  I know some value guys that were scooping this up in the sub $10 levels and most of them are still holding and buying on dips.  I've been waiting for the signal to get in and will likely hop on this trend with the next significant pull back.  Here's the chart:

As you can see, the weekly chart has been consistently heading higher and with the political mess surrounding drillers like ATP, there's likely going to be explosive up moves with any news that is percieved to be favorable.

It is important to have a good watch list of some potential energy and commodity stocks that you can follow on a daily and weekly basis.  Mine consists of:  HAWK, ATPG, GEOI, MXE, HERO, , CWEI, MRO, XOM, SLB, EP, ABX, NEM, FCX...and a few others.  Over the past couple of weeks, we have seen the dollar strengthen quite a bit which is significant.  Why?  Because stocks are slightly overbought in general, commodities have risen quickly, especially coal, aluminum, gold and silver and longer term treasuries have fallen substantially.  This sets the stage for a pullback in general but with the Eur/Usd falling below 1.2950, market participants will likely cut their exposure to risk and commodities, bonds and stocks will react to this.

I don't believe that it will be a huge reversal and will likely be a healthy pullback that will be percieved as a good buying opportunity.  That's just my opinion and if some substantial global macro shift occures (like the EU splitting up) then all of this is null and void and I'll have to adjust my analysis.  But without a substantial event like a sovereign default, a wave a municipal defaults, or some horrendous economic data any dip will likely just be a dip.  That's why having the watchlist of good pre-planned trade candidates is so important.  When everyone else is panicking, you can go in a sweep up ATPG at a good price that allows for a lower risk entry. 

Time and price action will tell.  Hope everyone's having a great start to the new year!

TLT

Thursday, December 30, 2010

The Art of the Entry

Here's an example of how I like to enter trades.  This example uses the Eur/Usd.  I went long the Euro yesterday and added a piece to the trade today.  Here's a screen shot of the 1 Hour, 15 Minute and the 5 Minute charts for the pair, with my TLT Trender v2 signals:

I initially went long with the buy signal, the green bars, on the one hour chart (the chart to the left).  Because a buy signal is in place, I then will look at smaller time frames for another entry signal in the same direction.  I got one this afternoon.  The 15m chart (upper right) gave some yellow bars.  That is the equivalent of the hammer on the gun being pulled back..just needed a signal to pull the trigger.  The signal will be the next buy signal on the 5 minute chart (bottom right).  As you can see, it came about 45 minutes after the first yellow bar on the 15m chart. 

Now the positions are on and they will be trailed with stops on the hourly chart.  Notice that I didn't go into the mechanics of what the green, red, yellow and blue bars are and how they work.  It's enough just to know that Green is buy and Yellow and Red are sell signals.  The concept that I want to get across in this post is the idea of using the Buy/Sell/Buy pattern with different time frames.  Have a buy on the higher time frame, with a sell signal on the intermediate time frame and then buy on the next buy signal within the short time frame.  You can use whatever type of indicator that you like, as long as you're familiar with it and have a good grasp on how to use it.  The Buy/Sell/Buy pattern can allow you to enter long or short (Sell/Buy/Sell) positions in spots where risk can easily be managed...and that is half the battle.

Hope everyone has a Happy New Year!

TLT

Monday, August 16, 2010

Looking for a Bounce in the Eur/Usd

The dollar has rallied over the past week as the risk trade was clearly taken off the table.  Equities finally worked off their Overbought levels and so did the non-dollar currencies.  Today's action in the Eur/Usd was particularly appealing and I took a small position in the pair this morning.  Here's a Daily, Hourly and 15 Minute chart:

As you can see, the pair is in oversold territory on the stochastics and the v-stop on the hourly has flipped to a buy.  What I really like about the pair right now is the bullish swing low (higher high and higher low after the sell off) that occurred right at the 50 day moving average.  I drew a couple of lines above the price action (and forgot to mark them..oops).  These lines are my price targets.  I will trail my stops up to the targets using the V-Stop on the hourly chart. 

Notice that I'm booking partial profits early and using the hourly to trail stops...this is  because the market has been choppy lately and to make money, you really need to be nimble.  I've been adjusting my expectations on each trade that I place because this market can turn on a dime and when it turns, it moves quickly. 

Hope everyone's having a great week so far.

TLT

Thursday, July 15, 2010

Eur/Usd Update

The Euro has continued to rally..the only question now is how long will it last? I don't know and will look to price action to get me out of my current long position. Here's the current daily chart:
One thing that I find interesting about the Euro right now is that the correlation between the Dollar rising when the stock market declines seems to have been decoupled.  For example, this morning when stocks slid more than 1%, the Euro rallied.  What does this mean?  It could mean that the currency market has merely changed it's relationship with stocks.  It could also mean that the currency market is not worried about Europe anymore..the worry is with the US.  Not a far fetched theory.

It's too early to tell, but it will be interesting to see how this plays out.  The only thing that I can say is that according to my system, the right trade is to continue to hold the long Euro position. 

TLT

Wednesday, July 7, 2010

Buy Signal On the Euro/Usd

I don't really like it, but I'm in it. The Euro rally that occurred last week on July 1st triggered a buy signal in the Euro/Usd. Personally, whipsaw comes to mind when I look at the chart but, only time will tell...you never know which signal is going to be the beginning of a huge move. Here's the daily chart:As for the stock market, I'm in cash right now and waiting for a fresh short signal or a buy signal. I can tell you that the path of least resistance is still down, so a new short signal will most likely be next..but you have to stay open to different scenarios playing out.

Hope everyone's having a great week so far.

TLT

Friday, June 4, 2010

Markets are Moving Today: Check Out the Eur/Usd

If I could only watch one thing to make all of my market decisions right now, it would be the Eur/Usd pair. This should not be surprising to anyone that follows the markets on a regular basis as everything has been following the dollar..and the euro. This pair represents a gauge on the overall fear involving Greece, Spain, and Portugal and it also gives you a heads up on what the risk appetite of the market is...dollar still rallies as a safe haven currency when the equity markets tumble.

Today the Eur/Usd has made new lows and the stock market is falling which is confirmation to continue to hold shorts. Here's a daily chart of the Eur/Usd:
I've made a few notes on the chart relating some of the more important things that I'm taking from it. The 2 most important things that I see, things that give me conviction to hold positions, are the fresh lows and the leveling out of the BB Width. I've found that the BB Width indicator is one of the best tools for determining continuation of a trend. When volatility kicks up, the short term BB Width rises above the 5 period average and more times than not we see follow through in the direction of the trend. When the BB Width is declining and below the 5 period average, we generally get consolidation with the potential for a short term reversal, which is what we've had lately.

So, right now, it's looking like the sell off of the Euro will continue and we'll also see the stock market sell off with it. Note that the BB Width hasn't risen above the 5 period average yet..but it has leveled and looks like it will likely cross. For now I'll be holding my long dollar and short equity positions and if the continuation is confirmed, I'll add a bit to the positions.

Anticipating what will happen and then having plans and contingency plans is the name of the game. If you make the proper plan, then it's likely that market action will not surprise you. Then if you add the ability to cut losses to the equation, you've got what it takes to trade successfully. Simple, yes. Easy to do, not exactly!

I hope everyone has a great weekend.

TLT

Thursday, May 13, 2010

Eur/Usd: Heading to New Lows or a Double Bottom?

Here's the daily chart of the Eur/Usd:I'm long the dollar (actually UUP via call options) so I believe that the pair's heading lower and that there's still room to go. We'll see.

TLT