Site Meter The Lawyer Trader: Market Opinion
Showing posts with label Market Opinion. Show all posts

Tuesday, May 22, 2018

Market is Looking Short Term Bullish..but I'm bearish over the next couple of years

Glancing at some charts today, the market is showing some short term bull signals.  The bump in volatility early this year looked more like the beginning of a regime shift than a normal pullback but only time will tell.  We've had quite the run in the indexes over the last few years and the market looks like it will give another push to new highs.  Here's a weekly of the SPY:
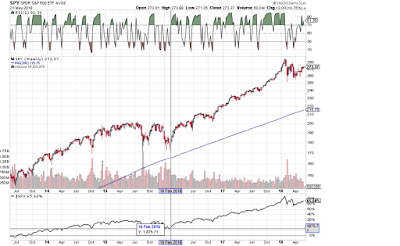
You can see the dramatic shift in price action starting in late January of this year.  Highs and lows are more extreme on each candle and the back and forth is very quick compared to the drawn out dips and slower climbs of the past 4 years.

Here's a very bullish chart.  This is a pair chart of the Consumer Discretionary (XLY) over the Consumer Staples (XLP).  If the chart goes up it is generally bullish because discretionary is outperforming the staples.
Of course, all of this is subject to change in about 5 seconds with something new hitting the market.  This just tells me that more money is still being placed in discretionary(bullish) rather than staples(bearish).  All things staying about the same, the market will likely try to push back up to the highs.

As for the long term, I still think we will be seeing some major volatility and a bear market coming out.  Real estate prices across the country are in a bubble on almost all levels and some signs of a slow down are already showing.  For all of the talk of lack of inventory, the real demand for housing for the lowest priced newer homes and those are the homes that builders have not been building.  Why build a $250k home to make $35-45k in profit when you can build a $750k home and make $100k in profit?  I expect this to be the last strong year in residential real estate and then for commercial to start slowing down too.

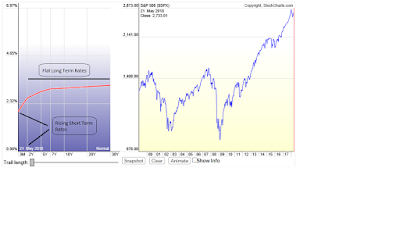
Still the most bearish yellow/red flag is the yield curve.  Short term rates have gone up, which we new would happen and the FED has been pretty open about it.  The problem is in the longer term rates that are flat.  This is the beginning steps for an inverted yield curve.
With the real estate market looking fragile and developers continuing to finance new development projects with 1-2 year interest only bridge loans (happening a lot!), the stage is set for people to get burned and then the real wave of panic will hit the market.  I'm not a big doom and gloomer but I like to be realistic.  Being realistic also means respecting the market action that is currently occurring and not trying to push your views on the market.  Just because I see the storms on the horizon doesn't mean I'm out shorting the market now..it just means I'm being defensive with longer term plays and gathering cash so that I'm ready for when things to get crazy.

Have a good week!

George
TLT

Monday, August 8, 2011

Headline Risk?

Headline Risk

What Does It Mean?
What Does Headline Risk Mean?


"The possibility that a news story will adversely affect a stock's price. Headline risk can also impact the performance of stock  market as a whole."


Read more from Investopedia.

It's hard to say, as the market never likes a "negative" event that has never occurred before.  Was there really any new information?  Does this really change anything?  There's a good chance this could be a big deal, but the other side of the coin is that the market will come to terms with it and start discounting what rating agencies have to say.

Just hang in there and don't panic.  I could be wrong but I don't see a "2008" scenario here.  As always,  only time and price will tell.


TLT

Wednesday, April 20, 2011

Looking at the S&P Bar by Bar

We've had some interesting price action over the last week.  I've taken this dip as an opportunity to add some longs for both me and some clients.  This market will likely continue higher and it will be confusing to many retailers when they see this market making new highs despite all the negative news stories.  Here's a quick break down of recent price action in the S&P via SPY:

I've pointed out 3 interesting scenarios that have taken place within the last 7 trading days.  First there was a strong swing low last Friday, which looked like an excellent bullish reversal.  That was followed by a  big gap down on Monday that had a false break to new short term lows (15-20 day lows).  The interesting thing about Monday is that a bunch of stops were likely taken out and then the market closed pretty close to the highs for the day.  I'd imagine quite a few retailers lost some money on that move.  Tuesday, the bulls were definitely back in control and going long above Monday's highs was a great short term long setup.  Then today...we gapped way up to 6 day highs and didn't lose too much ground.

From my point of view, this type of price action is showing that bulls are still in control.  Every time the market looks like its setting up a shorting opportunity, the move gets faded as buyers hit the market.  The long and intermediate trends are both up and that's how I will trade until that changes.  Going short in this market is for suckers that like to pick tops (a skill that very few can successfully do) or major suckers that like to pick up nickels in front of a steam roller (sure you might make a few cents here and there but you're taking an enormous risk).  As always, this is just one person's opinion and I am wrong just like many others...I've just learned to cut my losses over the years and to hold on to winners when the current trade is acting "right." 

Outside of the market, it has been hectic lately.  Work is incredibly busy and my wife and I recently closed on a new home and moved about two weeks ago.  Unpacking always takes about 10 times longer than I think it will..eh, you guys know about that.  I guess I'm saying these things to explain why posting has been limited lately.  I have managed to read a couple of interesting books lately and I plan on posting a couple of reviews on them.  Maybe I'll have time this weekend. 

Hopefully everyone is off to a profitable start this week!  Keep your head up and stay alert..this is a crazy market.


TLT

Saturday, January 8, 2011

Is $ATPG on Your Radar?

If it's not already on your watch list, you should add this one.  $ATPG has been a powerful play and it's picking up momentum.  I believe there's still room for this stock to run as it is slowly trending higher, as opposed to a parabolic rise (i.e. HERO, MPET, GEOI).  I know some value guys that were scooping this up in the sub $10 levels and most of them are still holding and buying on dips.  I've been waiting for the signal to get in and will likely hop on this trend with the next significant pull back.  Here's the chart:

As you can see, the weekly chart has been consistently heading higher and with the political mess surrounding drillers like ATP, there's likely going to be explosive up moves with any news that is percieved to be favorable.

It is important to have a good watch list of some potential energy and commodity stocks that you can follow on a daily and weekly basis.  Mine consists of:  HAWK, ATPG, GEOI, MXE, HERO, , CWEI, MRO, XOM, SLB, EP, ABX, NEM, FCX...and a few others.  Over the past couple of weeks, we have seen the dollar strengthen quite a bit which is significant.  Why?  Because stocks are slightly overbought in general, commodities have risen quickly, especially coal, aluminum, gold and silver and longer term treasuries have fallen substantially.  This sets the stage for a pullback in general but with the Eur/Usd falling below 1.2950, market participants will likely cut their exposure to risk and commodities, bonds and stocks will react to this.

I don't believe that it will be a huge reversal and will likely be a healthy pullback that will be percieved as a good buying opportunity.  That's just my opinion and if some substantial global macro shift occures (like the EU splitting up) then all of this is null and void and I'll have to adjust my analysis.  But without a substantial event like a sovereign default, a wave a municipal defaults, or some horrendous economic data any dip will likely just be a dip.  That's why having the watchlist of good pre-planned trade candidates is so important.  When everyone else is panicking, you can go in a sweep up ATPG at a good price that allows for a lower risk entry. 

Time and price action will tell.  Hope everyone's having a great start to the new year!

TLT

Monday, August 16, 2010

Looking for a Bounce in the Eur/Usd

The dollar has rallied over the past week as the risk trade was clearly taken off the table.  Equities finally worked off their Overbought levels and so did the non-dollar currencies.  Today's action in the Eur/Usd was particularly appealing and I took a small position in the pair this morning.  Here's a Daily, Hourly and 15 Minute chart:

As you can see, the pair is in oversold territory on the stochastics and the v-stop on the hourly has flipped to a buy.  What I really like about the pair right now is the bullish swing low (higher high and higher low after the sell off) that occurred right at the 50 day moving average.  I drew a couple of lines above the price action (and forgot to mark them..oops).  These lines are my price targets.  I will trail my stops up to the targets using the V-Stop on the hourly chart. 

Notice that I'm booking partial profits early and using the hourly to trail stops...this is  because the market has been choppy lately and to make money, you really need to be nimble.  I've been adjusting my expectations on each trade that I place because this market can turn on a dime and when it turns, it moves quickly. 

Hope everyone's having a great week so far.

TLT

Tuesday, July 27, 2010

Don't Fight the Tape

Well, my short position that I posted about was taken out when the resistance did not hold..this market is on a roll.  6 straight days of higher highs and higher lows.  Lots of traders got excited about the "Death Cross" and as it turns out, that was the point right after the short term lows that we have yet to see again.  What's the point?  The point is that if CNBC is talking about a major technical point, like the Death Cross, use caution. 
 Now I was short like lots of others, but not because of the Death Cross..I was short because my system was calling for shorting the market.  Now I'm out because the market is on a bull run and staying short through this action is merely fighting the tape..good luck with that.  What will be interesting is to see if we're still in a range bound market (likely) or if prices will continue to climb the wall of worry (2009 style).

I'll be traveling for the rest of the week and will return home next Monday.  Posting will resume then. 

Have a great week.


TLT

Wednesday, July 21, 2010

Bears Beware?

We saw a wicked rally yesterday and a substantial gap up this morning but, unfortunately for the bulls, prices plunged this afternoon.  That little rally was enough to inflict some pain on the shorts, me included, as I got to watch prices gap right through some of my stops and take me out of some positions that ultimately would have been great to have at the end of the day...kind of an insult to injury but that's part of the game.  
SPY Daily
 Technically, stocks still registered a higher high and a higher low, so there's still some hope for the bulls, but I think we're heading lower.  My indicators are calling for lower lows and fortunately, I've still got some shorts on the table...I got knocked out of my TZA (3X small cap bear) position but I'm still in the slightly tamer SDS (Ultra Short S&P). 

So should the Bears Beware?  Obviously, I don't think so and I've got my money where my mouth is.  That being said, there's always the chance of being wrong which is why using stops (even when you get whip sawed) and proper position sizing is so important.  The best trades tend to be at inflection points, where the market looks like it will go either way, because those are the spots that offer the best risk to reward.  The key is to have a reason (indicator, system, guru to follow, etc) that helps you determine which side to be on and  is right often enough to make money.  So my system is pointing down..we'll see how it plays out.

Hope everyone's having a great week so far.

TLT

Tuesday, July 13, 2010

And The Beat Goes On...

Markets had a good day today, as they continue their recent winning streak.  AA and CSX gave the markets something to rally over and it appears that INTC is contributing fuel for tomorrow since it's up 7% in after hours trading today.

Here's a quick look at some of my indicators that I update and maintain myself.  First up, the TLT Oscillator:

As you can see, the Oscillator score is positive (bullish) and the moving average just crossed into positive territory today (very bullish).  This indicator tells me that the intermediate trend is up for now..time to look for longs if you're not long already.  Of course this is subject to change as a couple of good down days could provide a negative score and drag the moving average back down to negative territory.  So I'm not saying that we should all pile on the longs and hold them right now, I'm just saying that this indicator (one that has been pretty reliable but subject to it's own set of limitations) says that the path of least resistance right now is up.

Another indicator to check on that I've posted about before is the Overbought/Oversold Indicator:
The Overbought/Oversold Indicator just crossed over the 4 mark into overbought today.  This means that I'll will be waiting for the market to back out of the overbought territory before entering any longs (assuming the trend is still bullish when we pull back).  I guess it's just a wait and see type of thing now.

TLT

Tuesday, June 15, 2010

Treasury Spreads Indicating a Possible Buy Divergence

Yep, treasury spreads might be indicating a further move to the upside. I've been tracking the yield curve for a while now and have recently been playing with some potential treasury spreads as indicators. There are several standard spreads that some people use, like the 30 year-3 month and the 10 year-3 month. I've come up with a composite of the 30, 10, 5 and 3 month that seems like it might be useful. Here's the most recent chart:Note that there was a considerable sell divergence back in April as the spreads began making new lows (converging) before the SPY topped out. Now there is potentially a buy divergence forming, although it is a less obvious divergence than the previous one..not sure if that gives it more potential for follow through or less. Regardless, it will be interesting to see how it plays out.

It seems that everyone (including yours truly) is expecting another sell off and markets generally play out in a way that confounds the most people. How could it do that right now? Well, we had very bearish technicals yesterday, as the market stalled out at the 200 day moving average, but (drum roll) it rallied today instead of following the obvious signals. So from here, it might rally a little more, just to make more of the shorts throw in the towel (yes they are scared right now). After a little more capitulation from shorts, we could see a massive drop...leaving previous shorts to wonder why the lost money on the short side. Just one scenario that I could see playing out.

The problem is, that it's hard to tell how many others out there are thinking the same thing. If that's the case and we're all holding our shorts waiting for "the others" to capitulate, then the market could end up just trickling up higher and higher, slaughtering the greedy (stubborn?) shorts. As always, time and price action will tell.

TLT

Friday, July 31, 2009

Another Look at the Pound and Other Ramblings

The Pound is creepin' back up after a brief sell off and this time it might just break out of 1.66 resistance area that has held it back. I have previously posted that I think the pound will see 1.75 if it breaks out of the 1.66-1.67 range. Here's a daily chart of the GBP/USD with the TLT Trender v2 indicator applied and some annotations:The Pound break-out theory fits in with my overall outlook for the markets right now. For the next several months, I believe that the dollar will fall against the euro and the pound, oil will rise, and U.S. equities will continue to rise. This has been the pattern lately and I believe it will continue for a little while, unless some major change takes place (i.e. a major shock to the markets). We're probably still in a secular bear market and this move is most likely just a big bear rally that will crash hard later when things get ugly again (maybe if/or when China melts down).

For now though, there is a lot of optimism in the markets and I'll stay with my opinions stated above as long as the markets keep shruggin off bad news. Just my 2 cents.

Have a great weekend.

TLT

Thursday, June 4, 2009

Cashin's Market View

"The market wants to go higher, it just needs some excuses."--Art Cashin on Squak on the Street this morning.