Site Meter The Lawyer Trader: Trade Review
Showing posts with label Trade Review. Show all posts

Wednesday, December 14, 2011

Covered My Eur/Usd Short

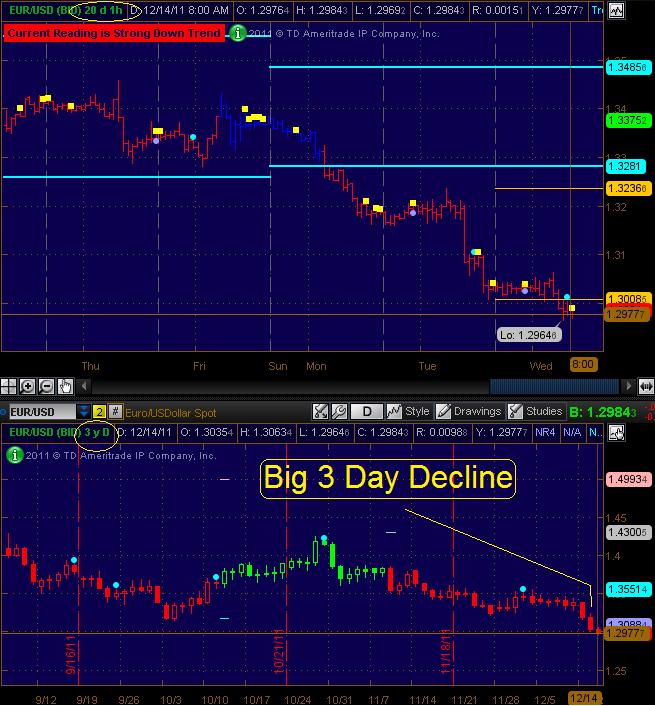
Over the past week, I have been managing one position...a short Eur/Usd.  It turned out to be a pretty decent trade that probably has more profit potential...however, booking profits seemed prudent right now.  Total, the trade booked about 400 pips which is a pretty big winner for my swing trading.  100-200 pips is the standard size for winners. 


The trade was a good one but I really wanted to blog about taking off the trade.  For me, booking profits is actually one of the hardest aspects of trading.  I have found that there are 2 methods that work for me.  A trailing stop or a profit target.  Quite often I use both.  For this trade, my take profit point was 400 pips.  It was tempting to continue to trail my stops but there is a high possibility of seeing a bounce.  3 day one direction moves usually get corrected.  Furthermore, we had a fed day yesterday and it's options expiration week..both are events that can move the equity markets and in turn put pressure on the euro.  Sometimes booking profits and sitting out for a bit is the best thing to do..as long as you fully accept that the trade "may" have been much more profitable had to left it on.

So what's the game plan?  I do think the Euro could fall quite a bit farther, it will just be a matter of patiently waiting for a pull back and an entry signal to put the trade back on.  This is likely a very crowded position and a good rally may shake out a bunch of the shorts and provide some fresh fire power for a move lower.  We'll see.


TLT
Wednesday, July 13, 2011

Review of a Trade Set Up: The Snap Crackle Pop Trade

This is a phenomenal set up in the forex and futures market.  Today, there was a great opportunity to go long the Eur/Usd with the Snap Crackle Pop trade.  The setup is basically just a "swing low" that most traders are familiar with.  A swing low is a 3 day pattern where one bar's price action is surrounded by higher highs and higher lows. Swing traders and day traders use these to go long and place a stop under the low of the swing low. The slight difference with this setup is that a couple of conditions have to be present on top of the swing low.  Let's use the recent price action in the Eur/Usd for illustrative purposes.

1.  Snap -- the instrument needs to me massively trending down and making new lows.  This is the important part of the trade that distinguishes it from a normal swing low.  The more bearish the better.  In the chart below, you can see that the Eur/Usd just broke a major support level and looked like it was going to drop like a rock.  This entices a bunch of traders to hop on to the short..even though they are late to the party.

2.  Crackle -- the crackle is when buying action kicks in and the Eur/Usd trades back up and closes near the highs with a long tail on the candlestick/bar chart.  This is commonly referred to as a bullish hammer.  These are the pros trapping the amateurs by fading the obvious "short trade" which leaves amateurs scratching their heads.

3.  Pop -- if buying continues, we wait for prices to break above the prior highs and we enter a long trade on that break.  The key to this trade is to be nimble and remember that you're probably trading a counter trend.  I like to trail a stop under the daily lows or drop down to a lower time frame (like the hourly) and trail an atr stop to get me out.  These trades usually last about 3 or 4 days (or bars on other time frames).

Here's the chart:

This trade is taking advantage of the retailers and the traders that are late to the party, over leveraged and not taking their losses.  We want to see a text book short sell that fails and traps these traders and then we ride it up as their stops are hit or when they finally throw in the towel and admit defeat.

Sound brutal?  Well no one said trading was nice.  The forex and futuers markets are zero sum markets and either you're the loser or you are taking the loser's money.  This is one of my favorite setups.  It works on all time frames but obviously, the bigger time frames like the daily chart make for bigger moves.

Hope everyone is trading well.

TLT

Monday, April 5, 2010

LVS: A Look at the End of Day Execution Chart

I traded LVS a little today. Wish that it was the only thing that I traded because I managed to rack up some losses early on but was fortunate enough to make them up and then some with LVS. This stock was an animal today...it just kept charging higher. One thing that I do on a daily basis is take screen shots of the execution charts for all the stocks that I traded that day. I have this setup through LightSpeed, the broker, with a 5m bar chart that shows all of the buy (green dots) and sell (red dots) for the day. My LVS chart for today is interesting. Reviewing these charts is helpful to me both on good and bad days.

As you can see from the chart, I made 5 trades in LVS today. I had more than 5 positions because I scaled into or out of some of the trades but I'll still consider this 5 total trades. Trade number one was a good start. It made money quickly and hit small profit target right off the bat. I usually book profits quickly when I trade within the first 15 minutes of the day because it's hard to get a feel for the market as a whole with such a short amount of time trading.

Trade number 2 was my big money maker. The reason that I found this execution chart interesting is because it really puts my trades in a good perspective in relation to the price action. I loaded up for this trade and I tried to hold as long as I could. It felt like a huge move that took forever, but it wasn't that big in relation to the rest of the day's action. Goes to show that one or two well managed trades that offer up a .30-.40 profit can make good money for a day trader.

This is what a good day's worth of trading one stock looks like for me. Sure I booked profits a little soon and I would have come out way ahead if I'd a just bought the open or the opening range break out and walked away or closed my eyes until the close, but this trading is what works for me. I can look at this chart and say that I should hold longer after the fact, but if today would not have offered up much follow through, these trades would look like solid gold. Obviously I'm still learning to gauge follow through but overall I'm happy with today's trades in LVS.

Hope everyone had a good Monday.

TLT

Thursday, January 14, 2010

Today's Heartbreaker: CHK

It was a pretty good setup going into the trade because oil and gas stocks have been relatively strong lately. CHK was on my radar this morning. It is one of 4 stocks that I'm tracking daily. This morning it gapped up above yesterday's high...very bullish...then it broke out of it's opening range around 9:10 (central time). This was the entry signal and a long was established at 28.27.

At this point, the trade's on and looking good and the main risk was the upcoming natural gas inventories report that would be released at 9:30. I tightened up the stop heading into the release and I established an "uncle point" back within the opening range (see chart below). This trade had some profit potential if the market reacted positively to the report. As you can imagine by the title of this post, it did not. Here's a 15 minute chart that breaks everything down:

Calling this trade a "heartbreaker" may be a bit of an exaggeration, as this was still a good trade, it just didn't work. There are a couple of lessons to take from this one: 1) be aware of economic releases...especially ones that specifically pertain to the instrument you're trading, and 2) respect your stops. Fortunately, I tightened the stop prior to the release and respected it. Had I not, I would be sitting in an underwater position that's going nowhere and tying up precious capital.

As for the market in general right now, I'm liking financials. In particular, I think there might be a good longer-term trade developing in WFC or several short-term trades. Keep an eye on WFC if it trades above and holds the $29.50 level.

Have a great day!

TLT

Thursday, November 5, 2009

A Quick Day Trade: MASI

Here's a quick day trade that I put on this morning. I went long MASI about 10 minutes after the market open. This turned out to be a decent little trade, although I left some on the table...my initial profit target was $29 but I booked profits at $28.20. I need to work on letting profits run a little more. Overall, I'll give myself a B for this trade. Here's the chart with my entry and exit:Like I said yesterday, I'm only taking day trades right now until the market gives a better indication of which way is the path of least resistance. The market will need to hit some fresh highs or lows in order to give that indication.

Have a great Thursday!

TLT

Wednesday, July 1, 2009

Out of OSK for a 39% Profit

Osk gapped up roughly 28% this morning on an upgrade and some news about a military contract. I bought this stock on June 17th after posting about it being a stock worth watching on June 10th.

Here's the chart:The gap up went right through my first profit target that was set at $18...my second target was $23 but I decided to bail out. Why? Well, I don't like holding onto a stock that just registered a massive one day gain like it did today. It might continue to go up, but, it might also sell off and close the gap...which I do not want to ride out.

Had this stock slowly krept up to my profit target, I would have only sold half my position, but I once heard that you should take quick "windfall" profits when they appear. Note that tajubg "windfall" profits is different than taking profits in general quickly...as quick profit taking in general is not a good strategy for trading. Unexpected "windfall" profits are a small gift that are occasionally given by the trading gods and they should be realized (in my opinion that is).

TLT

Thursday, June 18, 2009

Trade Review: GPB/USD

I caught a good move on the GPB/USD this morning while trading on the 5 minute chart. Most of my trades are based on the hourly time frame, but I'll also use the 5 minute time frame quite a bit. I noticed some good price action while Geithner was speaking this morning and then I waited for the buy signal. Here's the chart: Generally I wait for a yellow bar to exit long positions but this morning I knew that I would be away from my computer for a while so I just set a profit target. Coincidentally, the fisher MA crossed over the 1 line at about the same time the profit target was reached. As is noted on the chart, the fisher MA crossing the 1 line can be a sign that an uptrend is beginning to wane. This turned out to be a well planned and executed trade...and I got over 100 pips of profit from it.

Have a good day.

TLT

Wednesday, June 3, 2009

Out of AAPL

I booked my profits in Apple today...a nice little 17% gain. The trade lasted about 2 months and I bought in at the $119.00 level. Here's today's chart with my entry and exit notations.Two things concern me with the Apple trade:

1. Everyone's in it, and
2. Volume has been shrinking.

I'm not saying Apple is about to tank, it could keep going up forever, but I'm not comfortable with it anymore. I might buy back into it after a nice dip or some bad news.

TLT

Tuesday, May 19, 2009

Trade Review: Eur/Usd Long

Yesterday I put on a long Eur/Usd position and posted the chart that showed my entry. The trade was successful and I exited yesterday evening right after I got home from work. Here's the chart:As you can see, I booked about 45 pips from this trade. Not a huge trade, but a good one. Fortunately, I kept an eye on the pair later on into the evening because the hourly chart was in a really strong uptrend. I put the trade back on when my system gave me another buy signal later in the evening and I set a profit target of 1.3615, which the pair hit early this morning and I booked another 55 pips from the follow up trade.

The reason I would refer to these trades as good trades is because I had a plan and followed it. The trades may or may not have been profitable, but I stuck with the initial trade plan. That is very important, although the importance of sticking with a plan does not become apparent until you've been trading for some time.

TLT

Friday, April 24, 2009

Eur/Usd Update: Got Out

Had to get out of the Eur/Usd short. It started out as a good trade but it ended up being a loser. I'm out and on the sidelines for now. Will hop back on the short if the pair starts making new lows...and vice versa if it breaks the 1.34 resistance. Here's an hourly chart showing the exit point:Unfortunately, that was the only trade I made this week due to how busy work has been for me...hate to have your only trade be a loser. Oh well, there's always next week.

TLT

Sunday, April 19, 2009

A Good Potential Trade and Some Psychology

Sorry, I was really busy this weekend and didn't have time to post the TLT Trender signals...will try to post them some time tomorrow. Here's a potential trade...one that I'm currently in. Short the Eur/Usd. Yes, it rallied, and then it failed to achieve higher highs. Now's the time to jump in. I've got two targets right now: 1.27 and 1.25...we'll see if it makes it that far down. Here's a chart:
This trade may or may not work out, but it's the best currency trade that I see right now. Second best is long the Cad/Jpy...an oil play. We'll see how it works out.

I did put on a good continuation trade on Friday but unfortunately, it got stopped out. The only reason (or not really as you'll read about below) that I was stopped out was because the spreads were raised to ridiculous levels by my broker...like 20-30 pips on the Eur/Usd! Although this chaps me, I must also realize that it's my fault...my stop was not wide enough and I've even mentioned on this blog that setting wide stops going into the weekend is important, so it really does come down to me.

The sooner you learn to take complete ownership and responsibility for the outcomes of your actions, the sooner you can become a winning trader or a winner at anything else. When it comes down to it, everything in your life is the outcome of your own actions...whether you like it (or agree with it) or not. So make the best out of every outcome, whether good or bad, and either learn from an undesirable outcome or enjoy and grow from a desirable outcome.

So what does all this mean? For me, it means overcoming my natural feelings of wanting to blame external factors (my broker). What ticks me off is not the loss, as it was somewhat minimal, but the lack of profit because the Eur/Usd dropped down to my profit targets that I had set. Now, instead of just a loss, I have to deal with a loss plus a lack of profit. However, I will not dwell on this because I am taking ownership for the outcome and realizing that I should either accept the loss or just stop trading because blaming external factors does not lead to success...only learning and self improvement does. I'll stop preaching (ranting) now.

Hope everyone's doing well and is ready for a great trading week.

TLT

Friday, April 17, 2009

Trade Update: TNA

Sold TNA this morning for a nice little 10% gain. Will the stock continue to go up? Maybe, but my plan was to sell at the $24 level and I stuck with the plan. All-in-all, this was a well planned trade that worked out according to plan...love it when that happens. Here's the chart:The markets are a little mixed today...stocks are down right now but not by much. I'm holding a few currency trades (short Eur/Usd, Usd/Cad and long Aud/Jpy, Cad/Jpy) and a couple of stocks (long AAPL and ATW) and I think that will do it for this week. I might make a continuation trade (read here for explanation of continuation trade) if the Eur/Usd is still showing considerable weakness going into the close this afternoon.

Have a great weekend!

TLT

Thursday, April 16, 2009

File This One Under...Ouch!

This chart says it all.It happens to us all every now and then but it still stings.

TLT

Tuesday, April 14, 2009

LIve Currency Trade: Short the Eur/Usd

Good morning. Markets are a little mixed today after a few economic releases. I have a short term trade on in the Eur/Usd...found this trade while sorting through my morning chart scans. The dollar was strong overnight against the euro and this strength has continued throughout the morning. Here's the setup:
  • Saw a sell signal on the 3 hour chart;
  • Saw a sell signal on the 1 hour chart;
  • And saw a buy signal on the 5 minute chart, however, the last 3-4 buy signals and rallies on the 5 minute chart fizzled out quickly.
  • Therefore, I decided to fade the buy signal on the five minute chart and set a profit target for the prior lows in the channel.
Here's the five minute chart:As you can see, the outcome for this trade has yet to be determined. I'll post a follow up later today when the trade closes out.

TLT

**************************Update***************************************

It's just after 10:00 am and I just got stopped out. The trade looked good for a while but then it reversed. Fortunately, I didn't lose money because I had already moved my stop to break even...I try to do this with trades once they cross the halfway mark to my profit target. At one point in the trade, I was tempted to close the position with a small 10 pip profit, but, lately I've been bad about not letting profits run. Therefore, I left the trade alone and stuck with my plan. It's hard to do sometimes but I'm glad I did because I know it'll work out better in the long run that way. Here's the 5 minute chart with my exit:


Tuesday, April 7, 2009

Follow Up On The Usd/Chf

Plan the trade and trade the plan...this trade didn't work out as planned. The dollar picked up strength yesterday and the Usd/Chf popped out of the linear regression channel and stayed out of it. I did take a small position yesterday and it was profitable for a couple of hours, but now I'm out with a small loss. Can't win em all.

Here's an updated chart:Game plan for today:

Watch the Eur/Jpy--it's currently falling within in it's own trend channel and might offer up a nice buying opportunity;

Watch the Usd/Yen--this pair is still very strong but it needs to work of some overbought levels;

Watch the Eur/Usd--seems to be at a pivotal level..will go long if it holds the 1.3230 level at the end of today's session.

You can follow me on Twitter here for more updates throughout the day. Good luck trading!

TLT

Sunday, April 5, 2009

Nailed The Continuation Trade For A Quick 55 Pip Profit

A simple yet profitable currency trade is the "continuation trade." Here's a chart from Oanda that shows the continuation trade that I made this weekend.
Here's the setup:

  • The currency pair must be in a strong trend on Friday and the pair must remain strong as the close approaches;
  • Enter a position in the direction of the trend 5-10 minutes before the close (be careful to buy/sell before spreads increase) and set a profit target of 30-60 pips out...the size of the profit target really depends on how volatile a currency pair you trade;
  • Make sure to set a stop...I used the SAR level for the above trade.
That's it...easy. The idea behind the trade is that the currency pair tends to continue in the direction of the trend when the markets open up in Japan and Australia. There are several reasons that explain why the continuation occurs and I'm gonna leave those up to you to determine. This has been the 3rd weekend in a row that I've profitably traded this setup and I'm sure there will be many more.

Good luck out there.

TLT

Wednesday, April 1, 2009

One More Time With The Same Setup

Once again, I was going through my morning chart scans and the Eur/Gbp caught my attention. The 5m, 15m, and 30m charts were all forming identical sell signals with the same setup that I posted about yesterday. Here's a 5 min chart that shows my entry:As you can see from the chart, the trade quickly went in my favor...usually a good sign. Then the pair bounced back just a little after it almost hit my target. I used the bounce as an opportunity to add to the trade. I like to use a smaller time frame when adding to positions, so I pulled up the one minute chart and waited for a good entry. Here's the one minute chart:As the above chart shows, I added right when the signal line of macd was about to make a bearish cross and the stoch was oversold and beginning to point down. I also placed a stop just above the upper bollinger band channel. This turned out to be a great place to add to the trade and my profit target was quickly hit. Here's the last chart which shows the profit target being hit:Target hit and 45 pips were put in the bank today. The pair continued to decline after my target was hit...maybe I should start leaving a piece of the position on to capture any additional pips. Any of you guys scale out of trades that way? I know that John Carter leaves a little on the table with his forex setups in order to catch extra profit if the trade keeps going after the target is reached. Regardless, I planned the trade and traded the plan and it worked out well. I'm gonna close down the charts and get a little legal work done today.

Good luck out there.

TLT

Tuesday, March 31, 2009

Nzd/Usd: File this one under winner

One of the most basic trading setups that I've been using for a long time gave me a good trade today and I was able to pocket 70 pips. It was a trade that consisted of selling the Nzd/Usd or Kiwi short. Here's the chart:Here's the setup:

1) There's an established downtrend or sell signal (or uptrend if you're buying) on the higher time frame...in this case the higher time frame used was the daily chart, and the sell signal for the daily chart was the same as the signal for the hourly...a macd and stoch combination,

2) The MACD signal line has begun declining and is about to cross the moving average,

3) The stochastic is oversold and is moving lower.

Once I saw all of these conditions in place, I placed the trade and set a stop just above the upper Bollinger Band and I set a profit target for 70 pips based on the lows from earlier in the day. This trade ended up being a textbook trade because it played out perfectly...have to enjoy it because that doesn't happen that often.

So how did I come up with this trade? I found it by doing my daily scan through the charts this morning. I like to look over all of the daily, hourly, and 5 minute charts for all of the major currency pairs and a few of the popular crosses every morning. Going through the motion of looking through these various charts in different time frames helps me stay in tune with the market and it often generates a few trading ideas as well. This is a practice that I highly recommend and it's easy to do. Just spend 10-15 minutes and look over charts at roughly the same time every day and make note of any potential setups, patterns or trades.

Good luck out there.

TLT

Sunday, January 11, 2009

Economic Releases: How to Trade the Head Fake

The monthly unemployment numbers were released Friday and they were terrible...the unemployment rate hit a 16 year high at 7.2%. What's interesting is that the dollar ended up rallying against the euro after the economic release. Fortunately, I was able to make several good trades in the pair, both long and short. In this post I will share one setup that I use for trading economic releases.

First, this setup does not work with all economic releases, only big releases that generally move the market...or at least build a lot of anticipation about being market moving. Second, there needs to be a fairly strong consensus as to what is expected (like expecting a high unemployment rate).

Friday morning I had my charts up and CNBC on about an hour before the unemployment rate was released and I noticed the Eur/Usd was trading in a pretty congested range in anticipation of the release. The talking heads were talking about the up coming economic release and they were all in agreement that it would be a bad release. Then Rick Santelli came on and said that the pit traders were saying that it was not only going to be bad, it was going to be even worse than expected. This is the type of consensus I like to see when trading economic releases.

Here's a 5 minute chart of the Eur/Usd pair leading up to the release:
Okay, so I see the narrowing range and I hear that the unemployment rate will be worse than expected, (which is humorous because it is actually expected if it's being broadcast on CNBC) now what? If the street is expecting a bad number, then the pros probably know that the amateurs will think that the dollar will surely fall if the unemployment number is so bad. This is were the "head fake" comes into play.

The head fake or knee jerk reaction to the economic release is generally a false move and it allows professional traders to take out the amateurs' stops and position themselves for the big move in the right direction. For my setup, I enter before the news while the currency is in a tight range and I take a position in the direction that the amateurs are most likely taking (Friday's dumb money direction was to buy the Eur/Usd). The tricky parts of the trade are properly setting a wide enough stop (but not too wide!) and bailing out of the trade while it's in your favor. Here's a 1 minute chart that shows my entry, my stop and my exit after the release.
Notice how big the candle is for the minute that the unemployment rate was released. My stop was almost hit with the initial dip but then the pair quickly rallied in the "dumb money" direction and most likely took out lots of stops. To exit I use the 1 minute chart and I exit immediately at the first sign that momentum is waning. For this trade, the signal came in the candle after the release...the pair stop rising and then fell below the close of the prior candle...and I jumped ship and starting looking for a good entry in the opposite direction.

For the next trade, I pull up my trend following system and wait for it to give me a signal on the 5 minute chart. For this trade the signal came within 15 minutes from the unemployment rate release. Here's the chart:
As you can see from the above chart, the Eur/Usd kept falling after the release which provided a good trend trade.

So that's how I play the economic releases and I suppose you could just wait until after the release and the head fake to enter a position but I like to swing trade the head fake and get a few extra pips from the setup.

To recap, here's what you want to look for:
  • A highly anticipated economic release
  • A strong consensus that the release will be good or bad
  • A very tight trading range to enter into, it's also good to get the trade in early because the spreads are still lower.
After all of the above are in place then:
  • Enter in the trade before the release in the direction that the news release should move the market (the "dumb money" direction) and place a fairly wide stop
  • Then look for a quick pop, which will most likely be the head fake and get ready to bail out when you see a loss of momentum on a very short time frame chart (1 minute or less)
  • Last but not least, look to enter a new trade in the opposite direction if there is a follow through on the reversal.
Obviously this type of strategy is not for everyone, but it has helped me quite a bit when trading around market moving economic releases. When I first started trading currencies several years ago, I closed out many losing positions wondering why the market didn't go in the direction that it should have...now I've gained a little knowledge and a lot of experience and I know not to just jump on in the direction of the initial break. Just knowing about the "head fake" alone can save you from losing money is some painful trades...especially when you start with a profit and then watch it quickly turn into a loss.

There you have it. Good luck if you do attempt this type of trading, it can be nerve racking and frustrating at times. You have to be alert and also be ready to quickly admit defeat if your trade gets stopped out. Otherwise, there's the possibility of getting emotional and trying to trade your way out of the initial loss and we all know what that can lead to.

TLT