Site Meter The Lawyer Trader: yield curve
Showing posts with label yield curve. Show all posts

Tuesday, May 22, 2018

Market is Looking Short Term Bullish..but I'm bearish over the next couple of years

Glancing at some charts today, the market is showing some short term bull signals.  The bump in volatility early this year looked more like the beginning of a regime shift than a normal pullback but only time will tell.  We've had quite the run in the indexes over the last few years and the market looks like it will give another push to new highs.  Here's a weekly of the SPY:
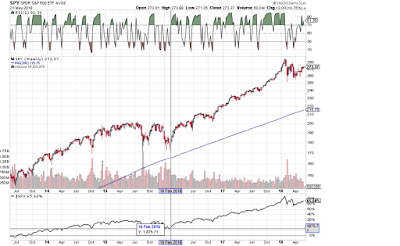
You can see the dramatic shift in price action starting in late January of this year.  Highs and lows are more extreme on each candle and the back and forth is very quick compared to the drawn out dips and slower climbs of the past 4 years.

Here's a very bullish chart.  This is a pair chart of the Consumer Discretionary (XLY) over the Consumer Staples (XLP).  If the chart goes up it is generally bullish because discretionary is outperforming the staples.
Of course, all of this is subject to change in about 5 seconds with something new hitting the market.  This just tells me that more money is still being placed in discretionary(bullish) rather than staples(bearish).  All things staying about the same, the market will likely try to push back up to the highs.

As for the long term, I still think we will be seeing some major volatility and a bear market coming out.  Real estate prices across the country are in a bubble on almost all levels and some signs of a slow down are already showing.  For all of the talk of lack of inventory, the real demand for housing for the lowest priced newer homes and those are the homes that builders have not been building.  Why build a $250k home to make $35-45k in profit when you can build a $750k home and make $100k in profit?  I expect this to be the last strong year in residential real estate and then for commercial to start slowing down too.

Still the most bearish yellow/red flag is the yield curve.  Short term rates have gone up, which we new would happen and the FED has been pretty open about it.  The problem is in the longer term rates that are flat.  This is the beginning steps for an inverted yield curve.
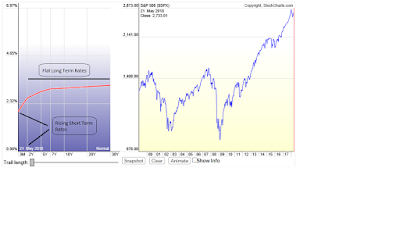
With the real estate market looking fragile and developers continuing to finance new development projects with 1-2 year interest only bridge loans (happening a lot!), the stage is set for people to get burned and then the real wave of panic will hit the market.  I'm not a big doom and gloomer but I like to be realistic.  Being realistic also means respecting the market action that is currently occurring and not trying to push your views on the market.  Just because I see the storms on the horizon doesn't mean I'm out shorting the market now..it just means I'm being defensive with longer term plays and gathering cash so that I'm ready for when things to get crazy.

Have a good week!

George
TLT

Tuesday, February 13, 2018

Almost 2 Years Since I've Posted...

Two years flew by.  Can't believe I didn't post anything in 2017..oh well back at it now.  Ironically, the last post from April 2016 was that the market was still where it had been for quite a while.  Obviously, its moved quite a bit since then..

After a two year bull market with a few blips of volatility, things are finally getting interesting.  I'm not usually too bearish, certainly not a doom and gloomer, but I'm getting a major 2007 early 2008 vibe right now.  Real estate is too hot, volatility is non existent (except for the last week), interest rates still have to rise at some point (don't they?) and we are due for at least a good hard pull back. Here's the chart that I'm watching on a quarterly basis..
Yep, the yield curve.  I've heard opinions from people that I respect about how the Trump tax cuts are going to propel this market much farther..blah, blah.   And they may be right but I still think it's interest rates.  I'll post again soon with a more in depth look at what I'm talking about but for the time being, here's the short of it.  The yield curve is flattening.  Short rates have been going up and long rates are not going up much in response.  This is the first time we've seen this in the yield curve in 10 years.  It's the interest rates..stupid.
So what am I doing in response to this?  Raising cash.  I've sold off most broad exposure to the markets and am just day trading and swing trading.  I've got a rent house that is way over valued based on the rental rates that the market gets..so I'm selling it in July when the tenant's lease is up.  Is this a run for the hills scenario.  No, probably not yet.  But I want to have ample cash when things do start moving so that I can a) not get hurt by a sudden sell off and b) have cash on hand to take advantage of deals and trading opportunities.

One other thing that I want to expand on soon is the blow up in XIV and the sudden scrutiny in the "risky" volatility products. It's such a bummer that the etn is going away and I'm worried that regulators are going to screw up VXX, TVIX and SVXY.  Those have been my cash cows for the last 5 years and what stinks is that there's not a good replacement for XIV.  More to come soon on that.

Trade well.

George
TLT

Wednesday, December 23, 2009

Market Overview

It's nearly Christmas and the markets have taken a slight pause today (some are up a little and others are down or flat). I thought it would be a good time to look over the markets in general and see where we stand. There's a lot of chatter about the annual santa claus rally, lets see what the markets say.

To kick it off, lets look at the S&P via SPY. As you can see from the chart below, the S&P has been stuck in a trading range since early November. The top of the channel has been tested several times in December but we still have not seen a meaningful break. I want to see it break and hold before getting too bullish on the market.

The recent break out in tech (qqqq) is good news for the bulls. Tech is looking incredibly strong and it will help move all the markets higher if it remains strong. I will be looking to enter a long position in either the nasdaq etf or the semi conductors (smh) if the S&P breaks out. Here's the chart for the Q's, note the break out:Okay, S&P is range bound, Q's are breaking out, what else should we be following for an indication...the small caps (IWM). The small caps have been the laggards lately but now they seem to be playing catch up. The Russell 2000 (IWM) is sitting (barely) at fresh highs which is another good indication for bulls. Here' s the chart:We'll go ahead and file the small caps under bullish for now, but this will change if it falls back into its prior range. Next lets take a glance at the VIX. The VIX has just fallen to some fresh lows and it actually closed below the 20 level yesterday...something that it hasn't done for some time. What does this mean? It means that worries are easing, at least for now. This is also a bullish sign for the short term outlook of the stock market.

So far, we have a neutral S&P that might break out (neutral), a breaking Nasdaq (bullish), a breaking Russell (bullish) and a falling VIX (bullish). That's 1 neutral and 3 bullish signs. Where's the case for the bears? Here it is, the financials.

Financials (XLF) have been a huge laggard and they will weigh down the S&P and the market in general if they don't perk up. Here' s the chart:There's the obstacle for bulls and fuel for bears. I don't know which way it will go and I'm certainly not smart enough to figure out how big of a mess the banks are (or are not) in. Furthermore, I can't even try to figure out the effects of the stimulus plan and whether that will provide enough cheap money to raise the market in general and make banks profitable, but there are lots of people out there that think the stimulus is merely going to provide profits to banks. I just watch the charts and try to determine which direction "order flow" is moving and then ride along.

One indication that can provide insight into whether banks will do well (and the economy in general) is the yield curve. The yield curve is currently steep, meaning short term rates are much lower than longer term rates. This is good for banks which in turn is good for the economy and markets in general. This is why the feds want the rates to remain low. Here are the current treasury rates and yield curve that are pulled straight off of Yahoo Finance's Bond Center. As you can see, longer term rates are much higher than short terms rates. This should help banks quite a bit and is indicative of good times ahead. However, there's always the concern that this time is different, especially considering that enormous stimulus plan and the worries of future inflation. We'll see how it plays out but for now I'm counting it as bullish.

So what else is there? The Dollar. The dollar has been in the headlines and has been talked about quite a bit lately. Most of the chatter has been about how bad the dollar is and that it's falling and going to lose half its value...blah, blah, blah. The dollar has actually been strong as of December and it appears that a reversal of some kind is under way. Here's the chart of UUP:Until recently, the dollar had shown an inverse correlation to the stock market, but that relationship seems to have changed as the dollar has been climbing with the market. I particularly like the long play in the dollar and I'm currently in it. One reason that I like it is that the dollar has been rising with stocks, but, the dollar also serves as a good flight to safety instrument that the world buys it when things start looking bad. Therefore, the dollar will likely keep rising in its current trend, and then if things get bad in the equities markets, the dollar will rally even harder. That's my current theory and like I said, I'm in this one.

Last but not least, Gold (gld). Gold has been on a bullish tear for quite some time, but now it seems to be falling back to earth. Why is gold a good short right now? Here's 3 reasons: 1) gold is likely in a bubble and bubbles break hard when they pop, 2) historically, gold has sharp climactic tops and long rounded bottoms and Dec. 3 sure looks like a climactic top to me, 3) the strong dollar will put pressure on gold prices. All of these things tell me that gold is a good (note not a sure thing) short right now and I'm currently in it. Here's the chart:Alright, here's a quick recap. The S&P is still range bound (neutral) and needs to break out, the Nasdaq is trending higher (bullish), the Russell is perking up and printing new highs (bullish), financials are lagging (bearish) but the yield curve is steep which makes it easier for banks to make money (bullish). The dollar is showing strength and gold is weak. These are neither bullish nor bearish (IMO) but they are very tradeable and I'm in both.

So what now? I'll be looking for a break out in the S&P with confirmation from small caps, financials and bonds (lower bonds). If this happens, I'll be looking to go long tech (QQQQ, XLK) and semi conductors (SMH) and short bonds (TBT). I'll also be adding to the long dollar position and the short gold position if they continue in my favor.

If the S&P doesn't break higher, watch out because we might see a substantial drop in the markets. For the bearish scenario, I'll be looking to short financials and emerging markets and look to go long utilities (xlu) and bonds (tlt). There's the game plan for the rest of the year and the beginning of 2010. We'll see how it plays out.

Have a merry Christmas and a happy new year!

TLT