Take a look at the chart below. What do you think? Would you go long, short, or stay on the sidelines? Take another look and decide what trade you would make.
I'll share some of my thoughts on the chart. I certainly would not go long because the 50ma slope is turning downward, which is very bearish. Furthermore, the 10ema is below the 50 ma and it just crossed the 200ma providing a nice signal to look for a shorting opportunity. Now here is the full chart. The vertical blue line is approximately where the first chart stopped. As you can see, this is a weekly chart of the SPY and it shows the 2000-2003 slide after the dot.com burst. Definitely don't want to be long. I really like using the different moving averages on the weekly charts because they can at least keep you on the right side of the long-term trend.
One more chart that provides some food for thought.
See any similarities between the above chart and the first one? Downward sloping 50ma...10ema crossing the 50ma and then the 200ma. Yikes! The current market is setting up sell signals in the broad indexes that we have not seen since the 2000-2001 time period. I think the path of least resistance is to the downside for now.
They say that doctors and lawyers make the worst traders...well that's just one more thing I must overcome.
Monday, September 29, 2008
Wednesday, September 24, 2008
Timber Investing
Interested in investing in timber? Check this out. It's not just for high end hedge funds and Harvard endowments, it's open to individual investors.
Interesting Post...
Here's a good post in which Dr. Steenbarger looks into the correlations of personality types and successful traders. For those of you not familiar with his blog, Trader Feed, you should check it out. Dr. Steenbarger researches some very interesting and creative ideas and then he openly posts his findings. A tremendously insightful blog!
Tuesday, September 23, 2008
Dollar Analysis
There has been a lot of talk about the dollar's upcoming collapse due to the bail out. I wanted to get to the bottom of what's really going on in the short-term with the old green back because commentators tend to exaggerate or just be flat wrong when they talk about the dollar.
As you can see in the EUR/USD daily chart below, the dollar has broken through its recent intermediate trend channel. This tells me that I don't want to be long the dollar but, I'm not ready to go against it either. With all the chaos of late, its very hard to tell if these types of pullbacks are full blown trend reversals or just emotional reactions. My gut says that it's the latter.
One thing that I'll keep my eye on is the 50 and 200 day moving averages. So far, the dollar has fallen back to its 50 day moving average and stalled. One indicator I like to use for trading in forex is the 10 day ma along with the 50 day ma. Once the 10 crosses the 50, it will confirm an intermediate trend reversal and I'll look for a nice pull back to sell the dollar into.
Interestingly, there are some out there that see this recent pullback as a bullish opportunity for the dollar.
Monday, September 22, 2008
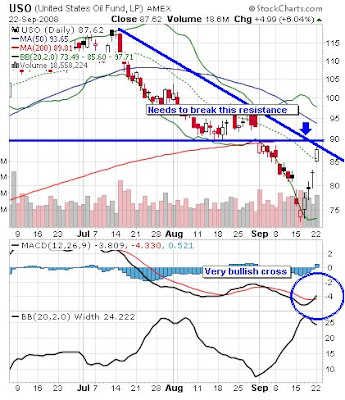
Selling smallcap and buying oil...
Lately one of the few bullish indexes has been the Russell 2000 but the recent false breakout and failed bullish indicator readings are telling me that the small cap set up might not pan out.
Instead of following through with the small caps, the street has been selling small caps and buying oil; perhaps the recent downturn in commodities is just a short-term dip. Only time will tell.
Welcome!
Welcome to TheLawyerTrader.net! This site is still in the development stage but hopefully it will be fully up and running soon. I plan on using this blog to share my trading experiences and hopefully others will share their opinions, views, and insights as well. Thanks for the interest and make sure to check back soon. TLT
Subscribe to:
Posts (Atom)